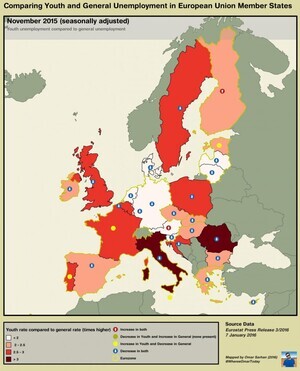
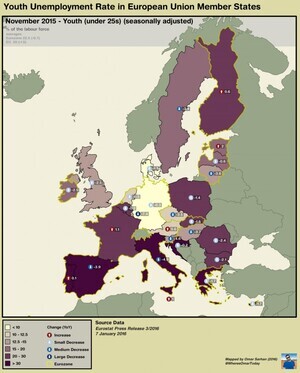
Further to his ‘controversial; jobless map of Europe…
Mapper Omar Sarhan writes:
A few days ago I created a map showing unemployment in Europe, I have explored the statistics further and took a look at the youth element. I created comparison maps (above). Now I am acutely aware that youth unemployment is a constituent element of general unemployment so the comparison does have its flaws. However it provides another way of visualising the data and the unemployment landscape.
I’m no social studies expert, but I think that when unemployment is decreasing in both categories it’s a positive sign. When unemployment is increasing for youth and decreasing in general this may indicate an economy with jobs going to older more skilled employees. I really can’t say anything for definite, but like a lot of maps it got me thinking and reading….
Meanwhile…
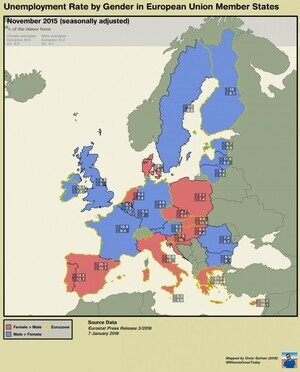
Omar adds:
The Eurostat statistics breaks down general unemployment by gender, some very interesting patterns. The level of unemployment is always going to be related to the social policies, economic strategy, economic base, demographic profile, immigration, and legacy gender issues. Each country has its own paradigm. I’m still reading into this so can’t come to any definitive conclusions. I am curious about the historical trajectory of these rates and what happens in an economic downturn or an upswing…
Previously: Jobless In Europe


Omar if you are basing unemployment stats on a report from Eurostat you’re already on the wrong track.
The IMF reckon Irish unemployment is 25%, personally speaking I know of someone who interviewed yesterday for a graduate position and was offered a zero hours contract with an hourly rate of minimum wage.
Paradise for the blueshirts!
Nothing like a bit of anecdotal evidence to make things clear.
anecdotal evidence ? Explain
Well, your unsourced, anonymous internet comment is proof enough for me.
And the usual two jumping on it speaks volumes.
Rob and rotide,
The example I gave is true, take my word from it. I’m not naming the company but would be more than happy to e mail you a copy of the offer letter, if you can provide e mail addresses.
I’m surprised you 2 are such doubters, after all you believed your furher’s stories about the man with 2 pints, the man with the fat pay cheque and the armies guarding the empty atms, all of which have been proven to be lies.
Do you have the link to the IMF report with the higher rate of unemployment? That’s quite a large disparity, so I very much wonder if they’re attempting to measure the same thing…
2013: http://www.irishexaminer.com/ireland/imf-irish-jobless-levels-are-staggering-227393.html
2015: http://www.independent.ie/business/irish/forget-parttime-jobs-real-unemployment-rate-is-24pc-says-imf-29358808.html
Ah. The unemployment rate specifically doesn’t include either discouraged workers, or the underemployed. That’s (at least amongst policy wonks) a pretty well understood facts. The CSO even publishes figures for the economically inactive (that’s discouraged workers). I’m not sure, but wouldn’t be surprised if we published figures for underemployment – certainly I’ve seen Michael Taft refer to them in the past.
This isn’t the IMF saying that the ‘real’ unemployment figure is 24%. It’s the IMF saying that labour force activation is still an issue. I’d be pretty certain that that’s an issue elsewhere in Europe as well – and comparing the 24% figure against other European countries numbers that didn’t include underemployment, or economically inactive citizens would be pretty useless.
“The IMF reckon Irish unemployment is 25%”
Sorry Ollie, but this is poop of the highest order. Find me the source or citation for this claim. Or, better yet, read the reasonably extensive IMF report into the Irish economic position, which makes absolutely zero reference to any potentially higher ‘real’ rate of unemployment.
http://www.imf.org/external/pubs/ft/scr/2015/cr15154.pdf
None of the tracksuit wearing tools who are lashing around my estate on scramblers seem to have jobs.Thats proof.
I thought the post office pays them a weekly wage to do that in an effort to reduce house price inflation in your area.
They are playing a vital role in avoiding the problems we had the last time the bubble burst.
Depends how you define a job Owen.
Is it by the FG definition? Jobbridge, unpaid internships? Zero hours? Part time?
Or a real job? 39 hours, decent wages, conditions, paid holidays.
I’ve provided links to the articles above.
I think you’re basing you’re 25% on an IMF report which was published in 2013. Someone linked to it when Omar published his last set of graphs. 25% means 1 in 4 people are unemployed. Here’s a report form the IMF from last January where it states the unemployment rate in Ireland is 11%
https://www.imf.org/external/np/ms/2015/012715.htm
Eurostat (via the CSO) are the only institution that collects unemployment numbers that close to being harmonised across the entire EU (and for which it would be reasonable to make such a map).
Those who dispute the unemployment figures often point to things like job bridge etc. This is a very fair criticism. To understand better one needs to understand first that unemployment rates are calculated based on International Labour Organaisation (ILO) definitions. The ILO breaks the working age population into three groups “the employed”, “the unemployed” and the “inactive”. A member of the population of working age people can only be one of the three in a given month.
If we denote those labour statuses as E, U and I respectively the unemployment rate is essentially calculated as U/(E+U). As you can see, those who are inactive do not count directly towards the the unemployment rate.
So what’s an inactive person? People in education and training are inactive, as are people who are not immediately looking for work and who are not about to start work, e.g. stay at home parents, people who are on lay-off, disabled people. The inactive population also includes individuals not looking for work because they think there is no work for them. It follows from this, if you can get unemployed people to go into training, you don’t have to count them as unemployed and they don’t count towards the unemployment rate. Likewise, if a factory or construction company has severely reduced its output so that it only opens or builds every other month the staff are counted as on “lay-off” during the months they are not working: they’re not employed, but they’re also not working. The inactive population that could start work tomorrow are referred to as “Persons available to work but not seeking”.
And what’s an employed person? The definition is quite long see (http://laborsta.ilo.org/applv8/data/c2e.html) ; but in short any person who receives pay or profit for engaging in economic activity. Or any self-employed person who engages in activities which improve their ability to make pay or profit (think of a plumber going to buy tools). There is no threshold definition of pay, and the amount of time one has to “work” in order to be employed is also not very much. The definition certainly covers those earning less than minimum wage and those working close to no hours. People who are working but would like to work more are referred to as “underemployed”.
Because of these anomalies, additional indicators are created by Eurostat, which are presented as a percentage of the labour force (i.e. employed plus unemployed). Have a look here:http://ec.europa.eu/eurostat/statistics-explained/index.php/Underemployment_and_potential_additional_labour_force_statistics
These data are for 2015Q2, and are not seasonally adjusted. For Ireland the underemployed workers (which should include job bridgers and people on zero hours contracts that have worked) is 5.5% of the labour force, which is high, but is decreasing compared with the previous year. The persons available to work but not seeking (e.g. those in training) is 1.2% of the labour force, which is actually low, the euro area average being 4.2% and the EU average being 3.7%.
The implication here is that in 2015Q2 while the unemployment rate was 9.8% in Ireland (and was below the euro area average 10.8%); the rate adjusted for underemployed and inactive people ready to work was closer to 16.5% (which is still less than the euro area average close to 19.7%).
Comment was meant for Ollie not the particularly well argued points above. Love me ‘aul data.
Excellent explanation Cosine.
source?
Thanks Cosine nice write up!