


From top: Aston Martin in South William Street, Dublin 2 last month; Michael Taft
Inequality is growing again and the income of the Irish 1 percent is growing faster than anywhere else in the EU-15.
Michael Taft writes:
The 1 percent serves as an excellent symbol of actually existing capitalism. Examining the inequalities between households gives an insight into the level of solidarity within a country.
Wealth and power is manifested in other systemic ways – namely, the level of financialisation and bargaining power between capital and labour.
Still, a system that produces a 1 percent will be reinforced by that same 1 percent. So let’s take a look at how the 1 percent is doing these days.
A standard measurement is by ratio.
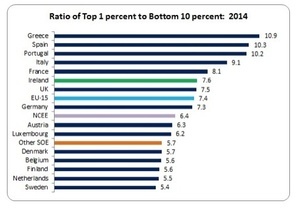
Here we see the ratio of the income of the top 1 percent (see below for a statistical description) to the to the top cut-off point of the first decile.
Though Ireland is not the worst – that is reserved for the poorer Mediterranean countries and France (this might help explain the rise of the National Front) – we’re still in the top half of the table.
We’re slightly ahead of the mean-average of the EU-15, but much higher than our peer groups: Northern and Central European economies (NCEE excluding the Mediterranean countries) and other small open economies (Other SOE).
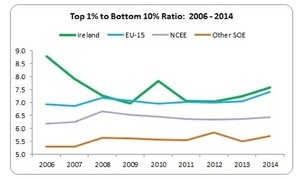
Ireland had very high levels of inequality towards the end of the boom period. The 1 percent took a hit with the crash given their greater reliance on property and speculative activity and this resulted in falling inequality: not because low income groups saw their income rise. It was just that their income fell slower than the 1 percent.
However, we will see below that not all higher income groups suffered.
But let’s first look at another measurement, the ratio between the 1 percent and the 5th decile – or that proverbial squeezed middle:
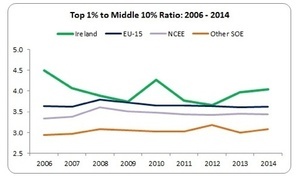
We see a similar pattern as with the ratio to the bottom 10 percent – except that since 2012, the gap with the top 1 percent has widened faster. And we see that in this measurement, Ireland has a high level of inequality. In fact, the gap between the top 1 percent and the middle 5th decile in Ireland is higher than any EU-15 country bar France.
It’s been quite a roller-coaster for the ol’ 1 percent in Ireland. In 2006, they had the highest level of income in the EU-15 bar Luxembourg. But by 2012, they had experienced a fall of 22 percent.
However, though they haven’t climbed back to their dizzying pre-crash levels, in the last two years their income has grown faster than any other EU-15 country with a growth rate of 13 percent compared to an EU-15 average of 3 percent.
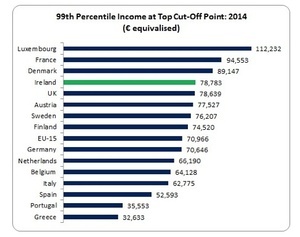
Even after the big recession hit, the Irish 1 percent still rank high in the EU-15 tables.
But not everyone in the high-income category are the same.
Unfortunately, we don’t have a compositional breakdown of the top 1 percent so we will have to make do with the CSO’s data which provides the top 10 percent.
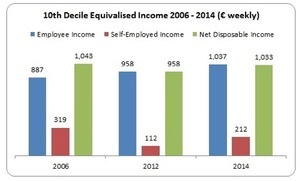
Let’s walk through this table. Between 2006 and 2012 we see that the weekly net income of the top 10 percent fell from €1,043 to €958.
However, employee income continued to increase (and remember, employees in this top 10 percent would include CEOs, senior executives and managers, higher professionals, etc.)
The hit was to those relying on self-employed income which fell by 65 percent. We can assume that a large proportion of this was property-related income. Reduced social transfers and higher tax would have also reduced overall net income.
However, since 2012 net income is rising. Employee income continues to rise and the fall in self-employed income has been reversed; indeed, it doubled in the two years up to 2014. Net income for the top income earners rose by 7.9 percent; for everyone else it rose by less than 4 percent. The gap is widening.
Of course, we can’t automatically assume that the 1 percent had the same rise in income as the overall top 10 percent. It might be higher, lower or the same. But I’m pretty confident – and I’ll give good odds.
Prior to the crash Ireland was highly unequal with the top 1 percent doing better than almost any other 1 percent in Europe. In the recession they took a hit but if the CSO data can be used as a proxy, then this was due mostly to the loss in self-employed income.
This decline has been reversed, inequality is growing again and the income of the Irish 1 percent is growing faster than anywhere else in the EU-15.
Yes, the 1 percent are doing alright.
Michael Taft is Research Officer with Unite the Union. His column appears here every Tuesday. He is author of the political economy blog, Unite’s Notes on the Front. Follow Michael on Twitter: @notesonthefront
NOTE: the tables present household income in ‘equivalised’ terms. This accounts for the size of the household (adults, children). In the Eurostat tables, the income level is based on the top cut-off point. For instance, for the bottom 10 percent, the top cut-off point is that income point in which people rise to the next decile. For the top 1 percent, this is the income at which they enter that top decile.


I win the ‘Massively missing the point of the article’ prize but that’s an Aston Martin, not a Maserati.
I also ran.
Parking on the footpath and a triple yellow line… The rage, the rage…
but, you know, it’s people on the dole who, etc etc etc.
eat the rich.
White collar crime in Ireland (tax evasion, vat fraud, inheritance fraud, hiding assets, company fraud, bribery of officials, insurance fraud, etc) costs the state ten times more than all social welfare fraud combined.
But you won’t read about that in the newspapers owned by the friends of those very same white collar criminals.
More taxes, quick!
For those who have more money than they can ever need. Yes. It is not right that so many work for a pittance and cannot afford to raise a family without fear of destitution. Tax is for the running of the country and safeguarding against social decay and poverty.
Those who can afford to pay a fair share of tax but consistently fight against it are selfish people who do not deserve the protections of the state they refuse to partake in. They are unworthy citizens and should be shamed at every opportunity.
That’s the ticket. Jake. If history has taught us nothing it is that all governments get to a point with taxation where they say ‘you know what, that’s enough money raised for now and forever’. :)
With so much wealth held in property, is it any surprise that there was a dip during the recession, followed by a rebound now?
I have no problem with wealth generated through work, as long as its taxed fairly.
Is there any analysis to suggest that Ireland’s 1% are not? Besides [redacted] who doesn’t live here.
Apart from transnational companies using charity as a vehicle for investments.
And the multi-billionaires who don’t live here.
And the inherited wealth
And…. yeah, ok….
“With so much wealth held in property, is it any surprise that there was a dip during the recession, followed by a rebound now?”
But Irish socialists are against a property tax, of course.
Inequality is firmly entrenched now & @ a far worse level than when Bust whistled through !! Trickle Down Economics is a failed policy & has been dis-proved in so many States & Still so many Folk reckon more Tax cuts shall fix all ??
That’s what we get for consistently voting in conservative, “center”-right governments.
Michael
Can you reliably say things about year on year changes in the top percentile? I am not so sure.
The data comes from the SILC which has a sample size of 14,078 in 2014. This is still very large but still less than 1% of all households. The cut-off for the top 1%in the SILC works like this. If you are in the highest-income 141 households in a year you are in, if you are only 142 you are out.
The issue is that regular sampling variation from year to year means that the 141/142 cut-off will bounce around and over/under-estimate the ‘true’ underlying value. This is just statistics. You can see it in the above. There is no a priori reason for why the top 1%’s income jumped in 2010 and fell back the next year.
Furthermore, at this level of the income distribution income gets more dispersed, so regular sampling error can provide greater natural variation than you will get between the 31st and 32nd percentile where the distribution is tighter.
The other issue is non-sampling error. The statisticians go to great lengths to make the sample representative along a range of dimensions but you cannot get this perfect.
I would be more confident about other SILC outputs such as the Gini coefficient and that at-risk-of poverty rate because they draw from the whole SILC population.
Also, there is a reason you got the 1% number from the Eurostat website and not the CSO one, despite the underlying data being collected by the CSO. As a wiser head once told me, generally if the CSO don’t generate a number it is because they don’t trust its reliability!