


The Swedes are becoming more like the Irish rather than the other way around, argues Michael Taft (above)
I was at a meeting a few days ago where a torrent of good news on the equality front was expressed; in particular, how Irish equality is reaching Swedish levels (some friends have also told me this is an increasing theme among some journalists and commentators).
Sweden, of course, is the popular benchmark for equality. So if Ireland is reaching those levels, surely we must be doing something positive on the egalitarian front?
Or are we looking at data without context, without reference to what we are measuring? We may be in a stat duel with calculators at dawn. So what is the story behind this data?
Income Inequality
In 2016, the ratio of the top 20 percent to the bottom 20 percent was 4.5 for Ireland and 4.3 for Sweden. In other words, the top 20 percent received 4.5 and 4.3 times the bottom 20 percent, respectively. That comparison looks pretty good. However, if we graph it historically a different story emerges.
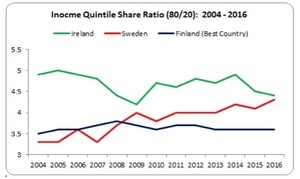
In 2004 Ireland was considerably more unequal than Sweden. By 2016, the two countries were almost the same. However, a disproportionate amount of this gap-closing came not from a better Irish performance but a seriously deteriorating Swedish situation where the ratio rose from 3.3 to 4.3.
The best performing EU country over this period was Finland where income inequality didn’t rise. If anything, the Swedes are becoming more like the Irish rather than the other way around.
At-Risk of Poverty rates
In 2016, Irish and Swedish at-risk of poverty rates were almost the same – 16.6 and 16.2 percent respectively. But, again, the historical numbers tell a more nuanced story.
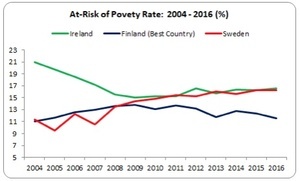
Irish at-risk of poverty rates fell between 2004 and 2009 – from 20.9 percent to 15 percent – while at the same time Swedish rates rose. However, since 2009 both Irish and Swedish rates have been rising, with the latter rising slightly faster. Again, we see a deteriorating Swedish performance largely contributing to a dove-tailing of the two countries (with Finland, again, being the best performer).
In-Work Poverty Rates
In this measurement we see Ireland performing much better than Sweden. In 2016, 3.7 percent of Irish workers were at-risk of poverty compared to 5.8 percent in Sweden. Irish rates are still above 2009 levels (the first year both countries report) while Swedish rates have fallen. But other data tell different stories.
In 2016, 2.7 percent of Irish workers were in severe material deprivation; only 0.5 percent of Swedish workers suffered this. Irish rates are still above 2009 levels (but they have fallen from a high of 5.3 percent in 2012) while Swedish rates more than halved.
In 2013, the earnings ratio between the top 10 percent and lowest 10 percent was 2.28 in Sweden (the last year they report). In Ireland it was 3.86 and it has increased in the three subsequent years – to 3.99. This measures employees’ earnings.
Two Other Welfare Measurements
Throughout society, Swedish severe deprivation rates are the lowest in the EU – at less than 1 percent. In Ireland, the figure is 6.5 percent. In measuring general deprivation (a slightly lower benchmark than ‘severe’) Sweden stands at 3.7 percent; Ireland performs far worse at over 15 percent, though thankfully this has fallen from a high of 25 percent in 2012.
In measuring living standards – actual individual consumption – average per capita spending in Sweden was €23,700 in 2016; in Ireland it was considerably lower at €20,800. Irish levels are still below crash-levels.
* * *
What does all this mean?
Sweden and Ireland remain poles apart on many measurements concerning equality, deprivation and living standards. Where they are starting to converge, it appears due to a deteriorating Swedish performance rather than an improvement in Ireland’s.
But this is less a story about the comparative data between Sweden and Ireland. Rather, it is a story of how data – isolated from the totality of information we have and the historical performance – can give us a misleading impression. This is a universal lesson, applicable to all information, all debates.
In short, data tells you what it tells you; what we have to look out for is how it used in any story-line.
Michael Taft is a researcher for SIPTU and author of the political economy blog, Notes on the Front. His column appears here every Tuesday
Top pic: Shutterstock


Some great points there – anyone can twist data to theirs unless the data is unequivocally the best or worst
To make policy and consider results i think we should look at what’s achievable by reference to the best and also recognize progress and where we are improving and better than average
Take the deprivation rates Michael cited, Ireland at 2.7% compares badly to most Scandi countries that are below 1%, but in the context of the EU average at 4.5% and the UK at 3% we do seem to be doing something right, and the rate has halved since 2013 (along with a general improvement across the EU)
b – I take your point. The perfect is the enemy of the good; however, we should always aim at best targets using best practice. We should be wary of using different countries as a model for our own. The Swedish or Nordic model is particular to those countries – historically and culturally; and they are coming under strains. We should learn but root our responses within our own historical and cultural model – and push out the envelope at every practical opportunity.
+1
thanks Michael
Great work Micheal – Bringing empirical clarity to these areas is of true value to society.
+ 1
Nice piece Michael :)
“…it is a story of how data – isolated from the totality of information we have and the historical performance – can give us a misleading impression.” <– That. To support Michael's point: longitudinal studies exist for a good reason, it yields more reliable data.