

 From top: left to right: Central Bank’s Head of Communications, Jill Forde, Director of Economics and Statistics, Mark Cassidy and Head of Irish Economic Analysis, John Flynn delivering the thrid quarterly bulletin for 2018 in the Central Bank of Ireland, North Wall Quay, Dublin yesterday; Michael Taft.
Last year the CSO introduced an innovative measure of national output in order to remove the distorting effects of multi-national activity (re-domiciled companies, R&D and aircraft leasing). It was called modified Gross National Income or GNI*.
Now they have modified the modified GNI. And our level of output has been revised downwards.

The recent modification reduced our national output by 10 percent. In other words, we find ourselves 10 percent poorer than we thought.
We have also found ourselves deeper in debt. When measured against GDP, our general government debt was 68 percent last year – below the Eurozone average.
However, when measured against the old GNI* our debt level went up to 100 percent. Now we find that our public debt is 111 percent of the new GNI*.
So, poorer and deeper in debt; and now we may find ourselves on the wrong side of the economic cycle. In the years since the end of the recession/stagnation, all our indicators have been in fast growth.
This was never going to last; it was a result of pent-up demand and foreign direct investment. Eventually it would settle down. But we may be settling down earlier than we thought – and at a lower level than we thought.
Let’s look at two indicators that are fairly detached from multi-national activities: personal consumption (consumer spending) and employment.
Personal Consumption
Personal consumption grew at a steady pace but the increase fell off significantly in 2017.

Consume spending reached 4 percent in 2016. However, growth suddenly cooled off at 1.6 percent. This was not anticipated. Early last year: The Government anticipated consumer spending to fall off by a marginal 0.2 percentage points in 2017
The ESRI expected consumer spending to marginally increase over the 2016 level
The Central Bank did expect consumer spending to fall off – by 0.9 percentage points. But this was more optimistic than the actual 2.6 percentage point fall.
It should be noted that in the first quarter of 2018, consumer spending actually fell on the previous quarter:
Employment
We see a similar fall-off in growth in employment. The following measures annual increase up to the first quarter.
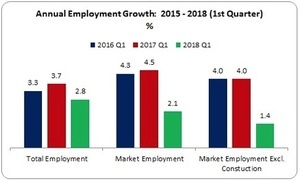
We find that total employment growth fell off in the year up to the first quarter in 2018. However, the fall-off was significant in the market economy (essentially the private sector, this excludes public administration, education, health and agriculture). Growth fell by more than half.
And if we exclude construction, the fall-off was even more marked. Again, only the Central Bank expected a fall-off close to this magnitude.
* * *
What does all this mean?
Growth rates immediately coming out of the recession and stagnation were never going to be maintained. They should ease off to more sustainable levels. However, there are signs that the levelling off is occurring earlier than expected and potentially at lower levels than projected.
The easing off of consumer spending and employment could be blips that will correct themselves this year. The Central Bank, while expressing surprise at the low levels of consumer spending last year, is nonetheless confident that it will rise again this year. We will have to wait and see whether the confidence is justified.
What happens if and when all those ‘known unknowns’ come down on us? Brexit, corporate tax reform (coming from the EU and the US), interest rate increases, a looming deficit in the Social Insurance Fund, trade wars, climate change, housing shortages, over-heating, concentration of tax/production in a few multi-nationals, etc.
Then there’s the ‘unknown unknowns’. We can’t break this down because, well, they’re unknown.
There is a fear, understandable given our recent experience, that any of these factors could lead to another recession. However, it doesn’t have to be as dramatic as that. We could enter a period of low-growth – so low that it feels recessionary.
In the 1980s it certainly felt like a recession but in actual fact the economy grew during most of that period – it just didn’t grow much.
So let’s look at the Government’s per capita projection for the next three years: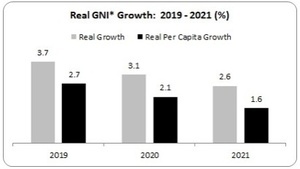
By 2021, real per capita growth will be 1.6 percent. It wouldn’t take much to knock those numbers downwards.
The challenges are considerable. Future fiscal policy will need to engage in debt-reduction, drive investment, close the deficits in our social infrastructure (housing, education, health, etc.), and avoid over-heating – all the while keeping within fiscal rules which even the Department of Finance believes are ‘dangerous’. What a balancing act.
Progressives and trade unionists need to enter this space and construct a progressive framework for the medium-term.
If we don’t, then others will do it for us. And given our recent experience, that wouldn’t be good for vast swathes of working people.
Michael Taft is a researcher for SIPTU and author of the political economy blog, Notes on the Front.


As someone with an interest in (but basic understanding of) economics, I enjoy these articles, and the commentary/ debates that follow!
I have a question on this bit:
“In the 1980s it certainly felt like a recession but in actual fact the economy grew during most of that period – it just didn’t grow much.”
How much is enough?
I’m open to correction but I recall reading that 3%+ real growth is needed for sustained job creation, as companies are more likely to invest in a growing market. 1-2% annual growth is a very slow burn and doesn’t tend to create that much net new employment. Lots of large economies (e.g. France) have this slow growth and so-called ‘structural’ unemployment of 8-10%. They have large social bills and get pissed off at our ability to at FDI with lower effective corporate tax rates. We will never have their level of services and infrastructure because we repeat the cycle of buying jobs at the expense of social investment. This works quite well for those gainfully employed in the sector, who despite our moans about taxes enjoy being in the 80th or 90th percentile in terms of income and standard of living.
Like you I have an interest, but no formal training in economics. My basic understanding is that we’re approaching full employment, and short of importing more workers than we already do, we’ll soon struggle to fill jobs. It could be a sign of overheating if high growth continues, much beyond next year. I think it’ll happen too, as I believe house building will kick off in anger again over 2019-2021, with construction output and employment pushing up the economy and risky investment increasing.
It’s also related to things like population growth and the rate of inflation.
For example, if your economy grew by 5% (which sounds quite good), but then inflation was at 6%, in real terms your economy has shrunk.
Similarly, if your your economy grows by 2% but your population has grown by 3%, etc.
Col – the standard prescription for steady long-term growth is 2 – 2.5 percent real growth each year – given that all the elements (exports, investment, consumer spending) is in balance. However, Ronan’s reference to 3% + might be closer to optimal as we need to measure growth per capita (as I point out in the post); all the more so given Ireland’s high population growth rate compared to most other EU countries. Of course, growth rates can only tell us so much – we need to look at how it is distributed, how it is invested, what sectors are prioritized.
Every Michael Taft article:
“The present is built on sand and the future is bleak.”
“Progressives and trade unionists need to enter this space and construct a progressive framework for the medium-term.”
“I’m not offering any solutions.”
So, apart from your comments directed at taft himself, can you give us your opinion on the points he’s made?
I’m not claiming to be the expert. I’d honestly love to see some solutions as to where we go from here.
But sure your ad hominem attack has clearly won the argument, so carry on as you were everyone.
ah, the bertie ahern “why don’t yis kill yer selves” approach to economic warnings..
Jonickal – there is something to your criticism insofar as analysis goes. What I tried to do in this article is bring to the attention of readers some data that has not entered the debate in any significant way. However, you might want to review past articles for ‘solutions’, ideas and suggestions: peace and disarmament, living wage, inequality, collective bargaining, fair taxation, social wage, etc. However, in all this, I would never suggest that these are the last word – proposals, ideas and analysis are intended to start debate.
Have CSO reworked previous year’s GDP in the revised GNI*?
While this means that we are 10% ‘poorer’ than we thought – it also implies that when we compare ourselves to other countries on spending relative to GDP/GNI* that our values should increase by 11%.
Three weeks ago you said that our Employee Personal Tax Revenue as a % of GDP(GNI*) was 10.4% compared to EU peer average of 10.9%; with the revised GNI does our tax revenue ‘increase’ to 11.5%? leapfrogging to 4th highest?
Cian – the main revision was the GNI* (GDP and GNP were slightly revised in the annual data which is not unusual). And while I haven’t done the new numbers, there will be revision to a range of comparative date – taxation, spending, labour share, debt, etc. But, yes, revision to employee personal tax revenue would jump from 10.4 to 11.5 percent of the revised GNI*.
Micheal,
Slight aside, last week a number of people were quoting your article from Jan 2013 that “Ireland covered 42% of the bank bailout”. Have you revisited this data in the last 5 years – is it still true? or has this dropped since.
Thanks
Cian – since that data (which is now out of date), the banking crisis has hit other EU countries – Greece, Italy, Portugal, Austria. The latest data from 2016 shows Ireland absorbing 22 percent of total Eurozone debt. You can have a look at the data here in the Summary Table (in that the relevant table is the first one – net revenue/cost for general government): http://ec.europa.eu/eurostat/web/government-finance-statistics/excessive-deficit/supplemtary-tables-financial-crisis
Thanks
The lack of a scale on the first graph makes the visual misleading. It doesn’t start at zero, meaning the difference is not as large as the graphic suggests.
Agreed – this is sneaky move.