


The breakdown of 14 years of official figures for suicide from the Central Statistics Office revealed on RTÉ One’s Claire Byrne Live last night.
The data, unveiled by the RTÉ Investigations Unit, probes the “misconceptions and realities of one of Ireland’s most intractable social problems”.
Ken Foxe writes:
The figures were broken down according to geographic area, county, province, age, gender, the person’s employment status, and even the way in which the person died.
Throughout the recession, reports frequently spoke of Ireland’s suicide ‘epidemic’ as the number of people taking their own lives appeared to inexorably climb. The number of people dying in suicides each year has been rising and that figure reached a new high in 2009 when 552 people took their own lives. However Ireland’s population, all through the boom, had also risen dramatically.
Between the census of 2002 and the census of 2011, the number of people living in the Republic grew by more than 650,000. While the actual number of suicides was climbing, this was to be expected in such a rapidly growing population.
Rising unemployment, collapsing investments and negative equity were all partly blamed for the increase, yet behind the stories, the rate of suicide was not changing in the way it was being portrayed.
The rate of suicide in Ireland hit its peak in 2001 at 13.5 suicides per 100,000 people and by 2004 – a “Celtic Tiger” year in which economic growth was running at 4.6 per cent – the rate still remained at 12.2. That 2004 rate of 12.2 per 100,000 has never been exceeded since.
Suicide – The Figures (RTÉ Investigative Unit)

It’s okay to not feel okay and it’s absolutely okay to ask for help.
#Bressie #cycleForSuicide #PRcampaign #moneyRacket
Hey Jessica! The Operation Transformation interviews will be held again; hang in there. in the meantime try a therapist or your sponsor with those nasty resentments. Eating and sensibly and drinking less booze helps too.
You know that the the alternative to Austerity is not “No change in GDP”!!
Really scummy to score political points
It’s not about “austerity” – it’s about people losing their jobs, businesses failing, going into negative equity.
Not sure if you’re hopelessly ignorant of economics or just simplistic w@nkers
People losing their jobs and negative equity?
How do u explain the suicide rate being as high in 2003 when unemployment was at close to all-time lows and practically no one in the country suffering from negative equity? Perhaps you’re the one who is ignorant of economic realities.
I’m not drawing conclusions;
I’m pointing out that Austerity – a choice made by Government is not a synonym for “recession” or “bad economy”
Interesting as it goes against most research from other EU countries. How certain is it that suicides are recorded as suicides? Are there other measures of wealth – though the line for suicide is pretty steady – maybe cultural reasons?
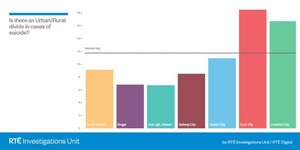
And what is going on in Cork and Limerick?!
They appear to have measured GDP growth rate in percentage points, and suicide rate as deaths per 100,000. These things are not comparable on the same graph.
I think the point is to establish whether as GDP goes down (recession) suicide goes up, so from that perspective it does make sense.
I thought it was more about the trends as well and to be fair, suicide rates look pretty steady across time
Yeah. That’s fine, but the scale of the charts may not be comparable. If you switched suicide rates to percentages of deaths the range would be 0.000118 to 0.000135%. It would essentially come out as a straight line. However, if you chose a baseline average for the suicide rate and then plotted the percentage fluctuation from that you’d see a wider fluctuation.
Basically, I don’t think they’re comparable as they are. What does GDP really measure when it comes to people’s lives anyway?
A fluctuation around a line doesn’t really mean much though, you will always get that. What they are looking for is a trend and how it is presented currently shows no trend. The GDP is there to show where you might expect to see an increase in suicide, they aren’t trying to compare them as such so the scale doesn’t matter here.
I disagree with your first sentence. Especially “you will always get that.” If you present the suicide rate data as I described above, in terms of percentage deaths, then you will get a straight line. If someone wanted to pretend that suicide rate was absolutely static and unperturbed by anything – it doesn’t have to be GDP – they could. The amount of fluctuation is relevant and that is influenced by the scale. How you select and present data is relevant. This is how climate change deniers have been trying to say the world isn’t warming.
You always get variation around lines of averages because they are averages across time and so there is variation around that based on individual time points.
No one is pretending the line is static because it is pretty static – it is pretty static, I’m not even sure you would a significant difference in the rates, certainly not a trend in either direction. Here are the raw suicide numbers http://nsrf.ie/statistics/suicide/ – there is very little movement so the scale doesn’t matter.
Climate change is different because of the timeframes that were being used to present the data in a biased way. This is not happening here because suicide rates are based on yearly numbers. If it was six-monthly rates in one place and yearly in another, you would be right.
That settles that one then. Hopefully people will stop using the threat of suicide as emotional blackmail to have their mortgages written off.
Thats not what this data says
Can you give one instance of that actually happening?
look at the Land League’s FB page
Banotti, trolling to beat the band today!
RTE telling us to stop blaming establishment policies for people killing themselves.
Hey look everyone, it was happening… anywayyyy.
Will RTE investigate how many people commit suicide due to child abuse in state institutions?
Like all statistics, especially those put forward by the media, this is meaningless. And the lazier the research the more meaningless it becomes – hence why RTE tend to be the most meaningless. If you want to an accurate depiction of the reasons for suicide you would look at each individual case and analyse why the person did it, then colate the data accordingly – Whilst that is something that would, naturally, be extremely difficult to do in practice.. you might as well otherwise compare it to the weather, the results of the national hunt season, full moons.
Tbf, If you want to an accurate depiction of the reasons for suicide you would look at each individual case you would ask the person but even that would be wrong if they didnt have good insight or were unable to articulate their feelings about it. This are actually pretty interesting findings as they go against most EU countries.
It’s not interesting. It’s meaningless gobbledegook. It would be meaningless in Spanish too. The media should be banned from bandying about pretty graphs and big bold percentages. Tonight on Prime Time – 75% of all women who drink wine make up 3/4 of the female wine drinking demographic- we ask what is with women and wine?
Just because you don’t understand it doesn’t mean it isn’t interesting. Your problem seems to be with misrepresentation of data by the media, which is a massive problem.
Biggest cheerleaders for the austerity-suicide hypothesis are RTE and co…
There’s no point in discussing this investigation as the number of suicides reported is incorrect. My brother committed suicide in 2003 and his death was recorded as misadventure. This was not the case. How many more deaths have been dealt with in the same. How many deaths that result from single car accidents are actually suicide? Just because someone didn’t leave a suicide note, it doesn’t mean their death is not a suicide. Instead of some simple statistics masquerading as in depth journalism, it would be more prudent to examine the cases that have been before the Coroner’s Court to determine the real figure.