

 [Click images to enlarge]
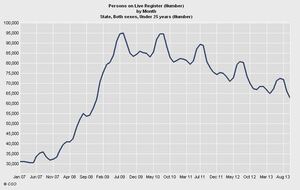
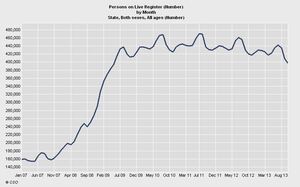
These graphs show the number of people of both sexes on the Live Register in the State aged under 25, over 25 and all ages between January 2007 and October 2013, (courtesy of the Central Statistics Office).
They show the number of people aged under 25 on the Live Register has dropped from around 95,000 in July 2009 to just under 65,000 in October 2013.
The number of people aged over 25 went from just over 340,000 in July 2009 to around 333,000 in October 2013.
The third graph shows, the number of people of all ages on the Live Register has gone from just over 430,000 in July 2009 to just over 396,000 in October 2013.
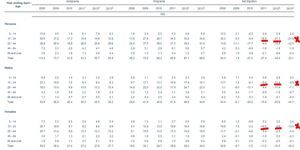
Meanwhile the last table, above, shows the number of people who have arrived and left the country since 2008. The net migration figure is a negative when more people leave than arrive and positive when more people arrive than leave.
It shows that, out of all the age groups, since 2011, the 15-24 age group has seen the worst net migration figures.
Proof if it were needed.
You can see details for YOUR own social welfare office here.
Previously: U25s With Jobs Fallen By 60%