
Jane from GetBulb writes:
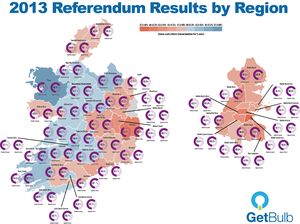
We created this map to show the breakdown of results in the Seanad Referendum. We’re not in the business of political analysis, but we do love getting our spatial representation on.
The scale runs from blue (majority “yes” vote, yes being those in favour of abolishing the Seanad) to red (dark red showing a majority “no” vote). The patterns are interesting, in that the areas that returned a majority “no” vote roughly correspond to parts of the country that have larger urban centres, or are in the commuter belt for Dublin.
Election results at a glance
Sponsored Link


