

 From top: Construction work last month on the Elsmore housing estate in Naas, County Kildare; Michael Taft
Since the crash bottomed out in 2012, employment growth has been substantial – 377,000 according to the CSO. This is a strong performance by any standard.
But there is some confusion as to where the growth is coming from and what it says about the economy.
Let’s run through some numbers focusing on employees or wage-employment (excluding self-employed) and the market economy, which excludes the mostly public sectors such as public administration, health and education.
In the period of 2012 to 2018 (2nd quarter), the number of employees in the market economy grew by 268,000, or 28 percent (in the non-market sectors employment growth was lower reflecting the Government’s hiring freeze – 72,000 or 14 percent).

Construction employment nearly doubled in the last five years; not surprising given the collapse of building work during the crash.
The next biggest increase came from Administrative and Support Services (a category that includes high-paid aircraft leasing employees and low-paid cleaners and security guards).
Coming third was the hospitality sector. Notably, while tech companies are usually associated with high employment growth, the increase in the Information and Communication sector was below the market economy average (though being high-income their consumer spending will help create jobs in other areas).
From what sectors did these 268,000 jobs come from?

Nearly one-in-four jobs came from the hospitality sector – a low value-added, low-wage sector. Employment increased by over 60,000. The next largest sector was construction, bouncing back from the crash. This sector grew by 53,000.
Combined, hospitality and construction made up over 42 percent of all employee growth in the market economy. Growth rates appear to be concentrated in these two sectors.
Let’s look further under the hood.
Administrative and Support services had the second highest growth rate. Eurostat tells us that 75 percent of this growth came from ‘employment agencies’ – primarily, agency workers.
While we can’t necessarily apply this calculation to the CSO data (different methodologies may be at work), it is indicative and is confirmed by Eurostat’s finding that the number of temporary agency workers has more than doubled between 2012 and 2017.
Another potentially worrying trend is the rise of temporary employment or fixed-term contracts in the latter part of the last five years. Temporary employment is considered at high risk of precariousness.

The trends over the last five years show that the total number of employees increased by 23 percent while temporary employment increased by 13 percent. However, the data shows a sharp rise in temporary employment in the last 15 months – 66 percent of the increase in wage-employment was temporary contracts.
We should be cautious about this, as the data has a couple of breaks in the time series which means that there was a change in methodology (e.g. different questions which could alter survey responses on precariousness). Nonetheless, it is consistent with the increases we saw above with temporary agency workers.
While the above refers to the market economy, there is one interesting insight from the non-market sector. Health wage-employment increased by 19,000 between 2012 and 2018. However, only 30 percent of that growth came from the public sector.
Public sector wage employment makes up only 56 percent of total health wage employment – and it is falling. Is this particular stat trying to tell us a story about the slow privatisation of our health sector?
The Irish Times’ Cantillon observed:
‘The rapid return to near full employment here is undeniably a good thing, but it highlights a remarkable volatility at the heart of the Irish economy that allows us go from boom to bust to boom again in barely 10 years. Stability is not what we do here.’
Too true; one has only to look at the boom-bust-emerging-boom in construction employment. This chart includes the self-employed.
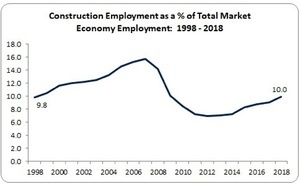
At the very end of the boom in 2007 nearly one-in-six people employed in the market economy were in the construction sector, and this doesn’t count other property-related jobs.
While we are still a way from that peak, we should expect construction employment to climb as residential and commercial building increases. Are we on another incline on the roller-coaster that is our construction sector?
The headline story for employment growth is good. However, when we look under the hood we find some worrying trends – growth in low-wage and precarious job creation along with the strong growth in the volatile construction sector.
It’s a good story but not without downsides.
Michael Taft is a researcher for SIPTU and author of the political economy blog, Notes on the Front.


Cheap foreign labour depressing wages and willing to work on temporary or zero hours contracts ?
Companies deciding on Friday what their staffing requirements will be on Monday ?
Welcome to free movement of people.
On Irish market wages are depressed by Irish CEOs,
it is Irish recruiters who decided there is no “talent’ in the country
And these practices are tacitly supported by Irish government Irish people elected
Just saying, like
Michael, I think you are being a little disingenuous with your figures:
Some things:
1. Notably, while tech companies are usually associated with high employment growth, the increase in the Information and Communication sector was below the market economy average.
This is technically true when we compare 2012 to 2017; but what you didn’t mention is that Information and Communication wasn’t particularly affected by the recession. It only dropped by 3.5% from 2008 to 2012….and has thus increased by 18% since 2008.
Construction, from 2008 to 2012 dropped by over 60%. and while it has increased by 95% since 2012 it is still 42% below it’s 2008 peak.
2 Eurostat’s finding that the number of temporary agency workers has more than doubled between 2012 and 2017. – your link here is broken – it only shows 3 years… but when I look at “Temporary employees by sex, age and economic activity (from 2008 onwards, NACE Rev. 2)” the numbers are all around the 160K between 2008 and 2017… so I can’t see major increase. Can you updated the link please?
3. you spend three paragraphs talking about the “potentially worrying trend is the rise of temporary employment” – although you rightly point out this may be a reporting anomaly. There is a clear seasonal peak/tough 6-monts apart… and you then choose a rise in the last “15 months” which happens to coincide with the annual trough in parttime work… to give you maximum increase. tut tut.
Another way of looking at the big picture is that the percentage of temporary workers/total workers has been dropping since 2012. For every 100 full-time jobs in 2012 there are now 123, for every 100 part-time jobs in 2012 there are now 113.
what would happen if our Brazilian friends didn’t come to work tomorrow?