Tag Archives: Central Statistics Office

This afternoon.

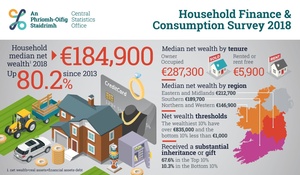
The Central Statistics Office published the results of its Household Finance and Consumption Survey for 2018 and compared the results with those of 2013, the previous year the survey was carried out.

Statistician Stephen Lee writes:

“The results show that in Ireland, the wealthiest 10% of all households have a net wealth greater than €835,000 while the bottom 10% have a net wealth of less than €1,000. Net wealth is calculated as the value of all assets minus debt.

In 2018, the median net wealth value of Irish households was €184,900, representing an increase of 80.2% on the 2013 value of €102,600.

The median value is obtained by arranging all households in ascending order from the smallest to the largest value and then selecting the middle value. In terms of wealth, the median provides a truer reflection of the average household as it is not influenced by extreme values.

The value of the household’s main residence is a key component of wealth. In Ireland, 69.5% of households own their own residence. In 2018, the median value for households’ main residence was €250,000, up from €150,000 in 2013.

The median net wealth of households that own their own home is €287,300 while for renters it is considerably less at €5,900.

We see that wealth is more concentrated in the ‘Eastern and Midlands’ region with a median net wealth of €212,700, compared to €189,700 in the ‘Southern’ region and €146,900 in the ‘Northern and Western’ region.”

Household Finance and Consumption Survey (HFCS) 2018 (CSO)

Today.

The Central Statistics Office published its Statistical Yearbook for 2018 including snapshots of each county.

The office also found:

“The average weekly household disposable income in 2017 was €929.01 up 4.7% on the previous year, while the average weekly disposable income per individual was €478.78 up 5.5%.”

Really?

It also found…

“The county with the most new dwellings completed in 2018, with 6,907, was Dublin, with 4,884 scheme houses and a further 1,746 apartments. Leitrim (67) and Longford (66) both had less than 100 new dwellings completed.”

Peruse the yearbook in full here

This morning.

The Central Statistics Office released it’s residential property price index for June of this year.

The CSO writes:

In the year to June, residential property prices at national level increased by 12.0%. This compares with an increase of 12.4% in the year to May and an increase of 11.4% in the twelve months to June 2017.

“In Dublin, residential property prices increased by 9.0% in the year to June. Dublin house prices increased 8.4%. Apartments in Dublin increased 12.8% in the same period. The highest house price growth was in Dublin City, at 12.0%. In contrast, the lowest growth was in South Dublin, where house prices increased 5.9%.

“Residential property prices in the Rest of Ireland (i.e. excluding Dublin) were 15.2% higher in the year to June. House prices in the Rest of Ireland increased 14.6% over the period. The Mid-West region showed the greatest price growth, with house prices increasing 22.3%. The Border region showed the least price growth, with house prices increasing 4.9%. Apartment prices in the Rest of Ireland increased 20.3% in the same period.

Overall, the national index is 19.5% lower than its highest level in 2007. Dublin residential property prices are 22.2% lower than their February 2007 peak, while residential property prices in the Rest of Ireland are 24.2% lower than their May 2007 peak.

From the trough in early 2013, prices nationally have increased by 79.6%. Dublin residential property prices have increased 92.7% from their February 2012 low, whilst residential property prices in the Rest of Ireland are 74.4% higher than the trough, which was in May 2013.”

Read the report in full here

Table from a Central Statistics Office report published earlier today

The Central Statistics Office reports:

In the year to May, residential property prices at national level increased by 12.4%. This compares with an increase of 13.5% in the year to April and an increase of 10.9% in the twelve months to May 2017.

In Dublin, residential property prices increased by 10.7% in the year to May. Dublin house prices increased 10.3%. Apartments in Dublin increased 13.5% in the same period. The highest house price growth was in Dublin City, at 14.6%. In contrast, the lowest growth was in South Dublin, where house prices increased 6.6%.

Residential property prices in the Rest of Ireland (i.e. excluding Dublin) were 14.1% higher in the year to May. House prices in the Rest of Ireland increased 13.7% over the period. The Mid-West region showed the greatest price growth, with house prices increasing 22.1%. The Border region showed the least price growth, with house prices increasing 3.7%. Apartment prices in the Rest of Ireland increased 15.5% in the same period.

Overall, the national index is 20.4% lower than its highest level in 2007. Dublin residential property prices are 22.5% lower than their February 2007 peak, while residential property prices in the Rest of Ireland are 25.5% lower than their May 2007 peak.

And…

In the 12 months to May, the median price paid by households for a dwelling on the residential property market was €235,000.

Dublin was the region with the highest median price (€359,000) in the year to May. Of the four administrative areas of Dublin, Dún Laoghaire-Rathdown had the highest median price (€528,500). Whereas, Fingal had the lowest median price (€315,000).

Outside Dublin, the highest median prices were in Wicklow (€310,000) and Kildare (€277,250).

The lowest median price for a dwelling was in Longford (€91,000). The next lowest were Leitrim and Roscommon (both €95,000)

Residential Property Price Index May 2018 (CSO)

This morning.

After a 12-month suspension due to quality issues in regards to PULSE data from An Garda Siochana, the Central Statistics Office resumed releasing its recorded crime statistics.

However, the new figures have been released under the proviso ‘Under Reservation’ because PULSE data is subject to several ongoing reviews and doesn’t meet the CSO’s standards for accuracy.

The revised homicide figures show between 2003 and 2016, there were three deaths wrongly categorised as murder, 196 road deaths which should have been classified as dangerous driving deaths and 41 deaths which should have been recorded as manslaughter.

The CSO also released its recorded crime figures for 2017 – also under the ‘Under Reservation’ tab…

Recorded Crime (Central Statistics Office)