Tag Archives: Michael Taft

shelf

Michael-Taft

From top: Shelf in Dunnes Stores; Michael Taft

The economy is growing.

So why have Irish living standards barely lifted?

Michael Taft writes:

Following on from my recent blog which showed that middle income groups received less than the national share of income than the EU-15 average (due to high income groups taking more) it might be worth having a look at general living standards in comparison with other European countries.

This is about living standards, not just income.
Eurostat measures living standards through actual individual consumption. Unlike private consumption (i.e. consumer spending) actual individual consumption ‘ . . . encompasses consumer goods and services purchased directly by households, as well as services provided by non-profit institutions and the government for individual consumption (e.g., health and education services).’

It, therefore, measures consumption not only of goods and services, but public services provided by the government.

As Eurostat states:

‘Although GDP per capita is an important and widely used indicator of countries’ level of economic welfare, (actual individual) consumption per capita may be more useful for comparing the relative welfare of consumers across various countries.’

In short, actual individual consumption can be treated as a proxy for living standards. So what is the relative welfare of consumers (i.e. everyone) across Europe?

1

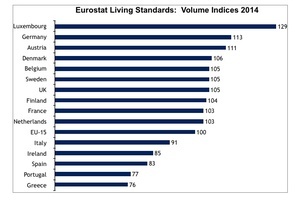
The above graph captures the relationship of real (after inflation) living standards in purchasing power parities between all EU-15 countries and the EU-15 average.

We can see that Ireland is in the bottom half of the table – 15 percent below the average. Our living standards are closer to Greece and Portugal than it is to the EU-15 average and the majority of countries.

Unsurprisingly, our living standards have been falling since we entered the recession. In 2008, Ireland stood at 95 – still below the EU-15 average and most other EU-15 countries; and that was with the wind of an unsustainable boom at our back.

During Fianna Fail’s reign (Austerity Round 1), it fell six points to 89. Under this government (Austerity Round 2), it has fallen a further four points to 85 (Austerity Round 2).

In 2014 our living standards fell relative to the EU-15 average – from 87 to 85. This coincided with all the good new stats.

In 2014, GDP increased by 4.8 percent – as often said, the fastest growing economy in Europe. In 2014, employment increased by 40,000. In 2014, the recovery started. This may help explain that oft-asked question: if the economy is growing, why don’t I feel it?

It should be stressed that this is a relative measurement – relative to the EU-15 average. In real terms (after inflation), Irish actual individual consumption per capita increased, but only slightly, while growth in the EU-15 was far higher.

2

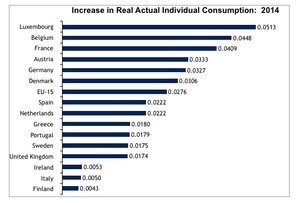
Note the contrast: Belgium and France saw substantial increases in living standards even though GDP growth in 2014 was 1.1 and 0.2 percent respectively. Irish living standards barely grew, even though it had a growth rate of four times that of the two countries.

Looking at the two main components – consumer spending and spending on public services – we can see why Ireland trails. These are measured in purchasing power parities.

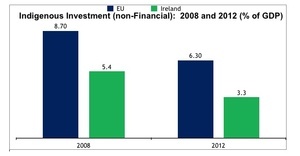
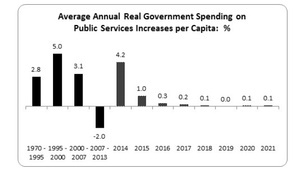
In 2014 Irish spending on public services was 7.5 percent below the EU-15 average while it was 32.3 percent below the average of our peer group – other small open economies (Austria, Belgium, Denmark, Finland and Sweden). This suggests that we would have to spend €2.4 and €10.5 billion respectively to reach these averages.

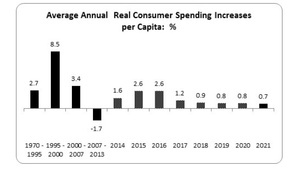
In 2014, Irish consumer spending per capita was 11.4 percent behind the EU-15 average and 14.2 percent behind the average of other small open economies. This suggests an increase in consumer spending for every man, woman and child of €440 and €550 respectively.

There are a number of explanations for this

First, the lack of labour rights in the workplace (e.g. collective bargaining, rights for part-time workers) which depresses wages; and, second, a weak social protection state – one that is characterized by ‘welfare for the poor’ and rather than protecting all those at work through access to affordable public services and income supports.

Another issue is high living costs. One may have a reasonable income but if services like childcare or prescription medicine or public transport are high, people will struggle after expenditure.

One can only hope that 2015 might see an increase in living standards. After all, we had a second year of being the fastest growing economy in the EU and further employment increases.

But we had that in 2014. And we still fell further behind in the living standards stakes.

Michael Taft is Research Officer with Unite the Union. His column appears here every Tuesday. He is author of the political economy blog, Unite’s Notes on the Front. Follow Michael on Twitter: @notesonthefront

00159032
Michael-Taft

Shopping on Grafton Street, Dublin last Christmas; Michael Taft

The ‘squeezed middle’ are used to blame low-income groups of being a burden on average earners and, therefore, argue for cuts in both social protection and taxation.

This is far from the reality.

Michael Taft writes:

Seamus Coffey, of University College Cork, has been digging up some more numbers which he self- deprecatingly refers to as one more ‘silly addition’ to what can be done with income distribution statistic.

But silly they are not. They give insight into another aspect of Ireland’s income structure.

When we debate income distribution we usually do so through the prism of the relationship between the ‘top’ and ‘bottom’ income groups or the Gini co-efficient.

What Seamus looks at are the fortunes of the middle income group and specifically compares Ireland with Sweden in the middle deciles (a decile represents 10 percent of the population).

I have reproduced Seamus’s table below but if it is difficult to read you can access it here.

1

The numbers measure the percentage of ‘equivalised income’ each decile receives (equivalised factors in household size).

In the table we see that in green Ireland, the lowest 10 percent income group receives 3.2 percent of all income; the top 10 percent receives 24.4 percent – or nearly a quarter of all income.

Regardless of the magnitude, there is nothing surprising in this. Top income groups take more than low-income groups.

However, Seamus points us to the middle of the decile group – what has been described in the debate as the ‘squeezed middle’ and compares us to blue Sweden.

There is a huge gap between the two countries in these middle deciles – 4th to 7th. Indeed, if Irish squeezed middle households took as much of a percentage of total income as Swedish middle decile households, each Irish household would be, on average, €5,000 better off. That’s a nice tidy sum.

Using the Eurostat data here is my own take. Rather than compare Ireland to Sweden (Sweden is pretty egalitarian but they’ve been at it for decades), I compare Ireland with the average of our peer group – other small open economies: Austria, Belgium, Denmark, Finland and Sweden.

And since I’ve used the middle 60 percent in the past I’ll keep to that and calculate the income for households in the 3rd to 8th decile. That’s a bigger middle.

2

Ireland’s low and middle income groups are below the share of those same groups in the other small open economies.

However the Irish top 20 percent group take considerably more than their counterparts in the other five countries.

What does this mean in Euros? If Ireland had the same share of disposable income:

Households in the lower income group would receive, on average, an extra €2,200.

Households in the middle income group would receive, on average, an extra €2,300.

Households in the high income groups would, however, lose on average €9,100.

In small open economies, low and average income groups make more at the expense of their high income groups.

Of course, one could argue that the real issue is not the share of total disposable income but rather how much income. You can be more equal but a lot poorer.

So let’s look at the top cut-off point for each decile (the point at which you enter the next highest decile) measured in purchasing power parities to factor in currency and living costs.

3

Other small open economies are more equal and more prosperous. Irish households are between 14.8 percent below the other countries (7th decile) to 20.6 percent below in the 3rd decile.

When income inequality is mentioned the first that many people do is reach for Robin Hood’s bow and arrow. Yes, it’s good to be well-armed but there are other issues besides tax and redistribution.

Here are two that might help explain the gap.

First, in other European countries there is greater collective bargaining coverage than in Ireland – one reason being that workers have a right to collective bargaining which employers are required by law to respect. This is not the case in Ireland.

Trade union density and collective bargaining have been show to increase workers’ wages.

Frank Walsh of UCD estimates that workers in trade unions engaged in collective bargaining are 8 to 10 percent better off than their non-union counter-parts in a like-for-like comparison (occupation, economic sector, workplace size, etc.).

But there are other labour-related issues: the right of part-time workers to take up extra hours in the workplace when they become available; the right of part-time workers to certain hours (that is, ending precariousness); and statutory rights to Sunday premium and overtime pay.

Strengthening labour rights through workplace organisation and statutory rights can translate into higher living standards for middle income groups.

Second, we’ve come to think of social protection as ‘welfare for the poor’. In other European countries, social protection is just that – protection throughout society and throughout the workforce.

For instance, if you become sick and your employer doesn’t have a sick-leave plan, you have to wait for a week to get Illness Benefit from the Social Protection Department and then it’s only €188 per week. In other EU countries you can start to receive sick-leave after the first or second day and they are income-related, covering up to 70 to 80 percent of your wage.

Or take maternity leave: in Ireland it’s a flat-rate of €230 per week. In other EU countries, up to 100 percent of the wage is provided.

A strong social protection system – that protects people both in work and out of work – helps maintains income during periods of illness and injury, temporary unemployment, maternity (and paternity) leave and retirement. That could be another contributing factor in supporting middle income groups.

There are some who use the ‘squeezed middle’ trope as part of ideological discourse that seeks to blame low-income groups of being a burden on average earners and, therefore, argue for cuts in both social protection and taxation. This is far from the reality.

You want help the ‘squeezed middle’? Increase labour rights in the workplace and build a strong social protection system. That’s an agenda for all workers.

Michael Taft is Research Officer with Unite the Union. His column appears here every Tuesday. He is author of the political economy blog, Unite’s Notes on the Front. Follow Michael on Twitter: @notesonthefront

90410849Michael-Taft

From top: Possible future coalition partners Enda Kenny and Michaél Martin; Michael Taft

We need a new conversation and a new way of doing business among progressives, just as we need these at the level of national and local policy.

We can’t expect people to change if we do not change.

Michael Taft writes:

So what’s it going to be? Coalition? Minority Government? Extended stalemate? What we do know is that support for the Government collapsed – by over half. Labour’s decline was anticipated, Fine Gael’s wasn’t – at least not in the pre-election polls.

We also witnessed Fianna Fail’s significant advance with a 40 percent increase in their first preference vote, winning an additional 25 seats.

In the new Dail Fine Gael and Fianna Fail look set to take 94 seats. In 2011 they won 95 seats. However, this is a smaller Dáil. In percentage terms, the two conservative parties won 57.2 percent of seats in the 2011 Dail; now they won 59.5 percent.

The conservative vote didn’t fall; it just swapped between the two parties. And this doesn’t count the increase in conservative and gene-pool TDs who look to increase from six to eleven seats.

Progressive parties and independents put in a credible performance. However, the breakthrough that many were hoping for (including me) didn’t come.

Sinn Féin increased their popular vote by 3.9 percentage points with the AAA-PbP increasing by 1.5 percentage points. Combined, these two parties look set to gain 13 seats – positive but about half the Fianna Fáil increase.

The Social Democrats took three percent but couldn’t increase on their outgoing total while the Greens are back in parliament with two seats. However, the number of progressive independent TDs doesn’t appear to be increasing at time of this writing.

So where next for progressives? Much will depend on the formation of government and potentially an election in the short-term. But for the medium-term here are a few suggestions.

1
. Start an Honest Conversation

In policy terms, wipe the slate clean. One of the messages coming out of the election was that people didn’t believe the promises to cut taxes, increase public spending and establish fiscal stability. Rightly so. There is little fiscal space – far less than parties claimed.
The future is extremely uncertain: low Eurozone growth, interest rates, oil prices, currency movements, the stability or otherwise of the European banking system. Then there’s the question of the character of the recovery (how much real, how much statistical). And what about Ireland’s continuing and unsustainable reliance on a corporate tax regime which works at the expense of other countries. Start an honest conversation about the challenges we face over the next decade – and don’t be surprised how many people will thank us for it.

2. Talk about the Economy

Strangely, there was little talk about the economy, about how we generate wealth, income, and sustainable enterprise activity. Let’s start that conversation. We can start with the rich and detailed analysis by the Nevin Economic Research Institute’s Tom McDonnel. You can read the full report here – Cultivating Long-Run Economic Growth in the Republic of Ireland – and an abridged comment here. It doesn’t address the all issues (no single document can) but it sets out the foundation:
Investment makes up 50 percent of long-term economic growth. If you want to ‘continue’ the recovery or ‘extend’ the recovery to those who haven’t felt it yet, you start with investment – driving up growth, productivity and wealth.
Education is another key component of growth – that and growing the working age population through immigration. Limited resources should be targeting at our youngsters’, starting with pre-primary education.
An infrastructural investment bank, affordable childcare, R&D spending, reduce inequality (which is more than just cash redistribution), advanced broadband – these and other initiatives can help promote a dynamic and enterprising economy.
Let’s remember the old Keynesian adage: look after the economy and the budget will look after itself.

3. Social Security

Revolving contracts, uncertain hours, low-pay, lack of rights: we are creating more uncertainty in the workplace which is driving down living standards and social prosperity. We must prioritise employees’ issues –ICTU’s Charter for Fair Conditions at Work is another useful starting point.
Alongside workplace uncertainty is social uncertainty. What happens if I get sick, or can’t find another contract soon; how will I care for my parents’ in their old age or afford to send my child to third-level education? These and other questions occupy more and more people. We must ‘socialise’ these costs through accessible public services and a strong social protection system – protection for people at work as much as for those out of work. And, being honest with people, this will only happen with a much high ‘social wage’ (or higher employers’ social insurance). That’s how continental European countries do it.

4. A New Way of Doing Business

Why don’t progressives talk about enterprise? It’s how we generate jobs, incomes and security. If low taxes and social insurance, low wages and ‘labour flexibility’ were the key to success, we would have the best indigenous enterprise sector in Europe. Instead, we have one of the poorest sectors. We need to grow investment-minded and productive companies – through public and municipal enterprise, new models involving labour-managed companies, new hybrid forms of non-profit and for-profit companies, community cooperatives and enterprises (working with local capital), and more attractive supports for private companies tied with public equity (if the state takes the risk, it should share in the success).
Business is too important to be left to Irish business.

5. Don’t Forget, We’re Europeans

How many times did Europe come up in the general election debate? Not much. If at all. We need to talk about the alliances we will make to advance policies that will benefit all those living in Europe. And this is not just about opposing TTIP (the Transatlantic Trade and Investment Partnership) or demanding our money back from the banks, though this will be part of it. What about the proposal to end low-pay by pegging minimum wages at the low-pay threshold (60 percent of median income in each country)? Or an economic QE programme to fund an investment programme in transport, telecommunications, energy, housing and education? And, of course, ending the irrational austerity programme through a progressive adaptation of the EU fiscal rules.
And while we’re on the subject of Europe – let’s call for Ireland to sign up to the Financial Transaction Tax being introduced through enhance cooperation.

These are just a few suggestions. Others will have more and no doubt better ones. But there’s one more thing: progressives must end the sectarianism and division among the Left and Centre-Left. Cooperation, tolerance and open-mindedness are needed now more than ever.

We need a new conversation and a new way of doing business among ourselves, just as we need these at the level of national and local policy. We can’t expect people to change if we do not change.

But there’s much to be hopeful about. Fintan O’Toole made an important point yesterday, rightly saying that the majority of the Irish people are moving in a different direction from the one the Government wanted to go – a pathway public services, housing, solidarity and more equality. We have a great opportunity to work with people in moving the country in that direction.

The future is progressive – if we make it so. That will take some hard work.

Michael Taft is Research Officer with Unite the Union. His column appears here every Tuesday. He is author of the political economy blog, Unite’s Notes on the Front. Follow Michael on Twitter: @notesonthefront

90286108

Michael Taft


From top: Unemployment line in Thomas Street, Dublin; Michael Taft


Political parties are promising all sorts of tax cuts. What if parties contested with each over the best in-work benefit policies?

Michael Taft writes:

The election enters the last few days. So many issues that were barely mentioned. How much time was given over to the fact that over one million suffer multiple deprivation experiences?

How much debate was devoted to the 100,000 households in arrears and the many more in negative equity? Remember that bank debt that we absorbed? But no mention of a Financial Transaction Tax to start clawing back a little of that socialised private debt.

And there was absolutely no time devoted to benefits for people in work (apart from tax cuts which workers will end up subsidising through reduced public services and income supports).

There was no mention even after a report published last week from Glassdoor, an international recruitment, company. The Journal ran the headline: ‘Ireland is bottom of the EU pile for social benefits’ This accurately described the report. Still no debate.

Glassdoor compared a range of social benefits for people in work and Ireland did not fare well.

Take for instance what happens if you become sick at work. In Ireland you have to wait six working days before you can draw down the benefit and you get a flat rate of €188 from the Department of Social Protection.

That’s about 27 percent of your wage.

What do workers get in other countries?

In the Netherlands, employers are required to pay 70 percent of pay for up to two years

In Germany, employers are required to pay 100 percent of the wage for the first six weeks. After that, the state pays 70 percent of the salary for up to 78 weeks.

In Austria, workers receive up to 50 percent of wage for up to a year.

The main benefit other European workers get (apart from the UK and ourselves) is sick-pay that is income linked (though in most there is an income ceiling; these ceilings are above the average wage).This cushions the fall in living standards for those who fall ill and maintains consumer spending in the economy.

What about family benefits for those in work?

Ireland has a very high level of maternity leave at 42 weeks, considerably more than most other countries. However, only 26 of those weeks are paid at a maximum flat-rate of €230 per week.

This is 33 percent of the average wage. What about other countries?

In Austria, Denmark, France, Germany, the Netherlands, and Spain new mothers get 100 percent of previous earnings for the whole period of leave.

Italy pays 80 percent of earnings while Belgium starts out at 82 percent, falling to 75 percent over time. Again, there are income ceilings above the average wage which, therefore, progressively benefits those on low-average pay.

In addition, many countries have paid paternity leave; not Ireland (though this has been promised in the general election campaign).

Another category where Ireland features at the bottom is unemployment benefit

It should be remembered that benefit is time limited in EU countries and is intended to bridge the gap between employment (what’s called frictional unemployment).

In Ireland, you get €188 per week (27 percent of average wage) for 26 to 39 weeks.

Other countries are much more generous:

Austria provides 55 percent of wage for up to 52 weeks.

In Germany you get 60 percent of wage for up to two years.

In Denmark, if you pay into an unemployment insurance fund (most do) you get 90 percent for up two years.

The rules in many of these countries can be quite complicated but Ireland has the weakest set of benefits for people between jobs, apart from the UK.

And what about holiday time?

Statutory holiday time (public holidays and paid annual leave) in Spain, Sweden, Austria, Finland and France is 35 to 35 days. In Ireland we get 29 days. We have to work a week more than workers in other countries.

We are towards the bottom of the table with the Netherlands and the UK on 28 days.

Political parties are promising all sorts of tax cuts. What kind of debate would we have if it focused on social security? What if parties contested with each over the best in-work benefit policies?

Wouldn’t we better off knowing that if we get sick our incomes wouldn’t collapse; that pregnancies will be supported by a generous support scheme; that transition between jobs doesn’t entail a collapse in income?

In Ireland, we assume that tax levels are the best indicator of living standards but this is incorrect. The best indicators are the benefits paid to workers when the face situations when they need the most help. A

And for all the billions being promised in tax cuts we could finance one of the best support programmes for workers in the EU.

And who wouldn’t mind a couple of extra holidays?

Michael Taft is Research Officer with Unite the Union. His column appears here every Tuesday. He is author of the political economy blog, Unite’s Notes on the Front. Follow Michael on Twitter: @notesonthefront

90408451Michael-Taft

From top: Construction on the new Central Bank on the north Quays, Dublin; Michael Taft

A blueprint to make life a lot better for a lot of people.

And one that won’t take up too much fiscal space.

Michael Taft writes:

In a previous post I suggested that the debate was getting out of hand. In actual fact, we have almost no fiscal space (not after inflation, demographic pressures and the sleight-of-hand regarding Irish Water investment).

Then there are those external events: low-growth, volatility in the equity markets, asset bubbles which rarely end up other than a bust (and still no one talking about Brexit).

Yet we have a promise-land political debate: tax cuts, more public spending, more investment – honey and manna and wine flowing; a detached from domestic and global reality. Eerily enough, the debate is even detached from the economy (as if throwing about small bits of money at this or that will change the fundamentals).

But one should be slow to criticise unless there is some alternative at hand. So here’s my go. However, mine has a different starting point than tax cuts or divvying up a tiny fiscal space.

I will address three issues– and none of them cost money (that is, impacts on our new friend, the fiscal space). But if pursued, they would make life a lot better for a lot of people.

1. Quality Workplaces

In a recent report the OECD claimed that earnings quality, labour market security and a quality work environment go hand-in-hand with higher employment. Of course; you can’t build a modern sustainable economy on low-pay, job insecurity and poor working conditions.

Therefore, let’s have a Decent Work Act which can help build quality jobs, based on ICTU’s Charter for Fair Conditions at Work:

Start the process to a Living Wage

End precariousness – through certainty of hours at work

Give part-time workers the right to extra hours in the workplace when they become available (this is actually a EU Directive that has yet to be transposed into Irish law)

A progressive public procurement programme – so that we don’t get images like these from Government Ministers, parading the vests and names of race-to-the-bottom employers
Statutory Sunday premium and over-time pay

The right to collective bargaining and a significant extension of Joint Labour Committees to all low-paid sectors and occupations.

This will start to give certainty in the workplace, promote quality jobs, increase domestic demand and investment – and the great thing is that it would actually be a revenue raiser for the government, not a cost.

Lesson: change the power relationship between labour and capital to start favouring the former.

2. Develop New Enterprise models

The debate assumes that we can build a modern market economy through tax cuts and eliminating red tape. If that was the key to success, we should have the largest indigenous enterprise sector in Europe. Instead, we have one of the smallest. So let’s get real.

In my last column I highlighted Davy Stockbrokers’ assessment of investment in productive activity prior to the crash – that the overwhelming majority of it came from public investment and public enterprise companies. So let’s learn and apply this lesson.

First, create new – and expand current – public enterprises; in such areas as advanced broadband, green technologies and alternative energy (e.g. ocean, etc.), public transport, etc. This can be through stand-alone activity, partnerships with private companies, whatever works.
From this we should enable local government (or create new regional institutions) to establish municipal enterprises – a standard feature in continental Europe and North America.

These are essentially local public enterprises but they can be formed in partnership with local and private capital. This would facilitate areas where there are low-levels of enterprise activity (whether urban ghettoes, cities/towns outside Dublin, or depressed rural areas).

But we can go further, supporting alternative business models: community and neighbourhood enterprises, labour managed enterprises, new company models based on commercial non-profit activities. And this could be funded – through equity – by the Ireland Strategic Investment Fund, with little impact on the Exchequer.

Lesson: once we get over the idea that jobs can only be created through private capital (and private capital alone) a number of alternatives can arise.

3. Housing, Houses and Homes

We have promises to sell-off council houses (great, we have too few social houses and what few we have we’re going to sell-off at a huge discount), provide cash transfers to people wanting to buy homes (great, pump demand, drive prices upwards and get more people into more debt); and rely on the private rental sector to house most people on the waiting list – at a time when private rental accommodation is falling. Laugh so that you don’t cry.

Two issues here:
First, the Government is expecting to get back up to €4 billion in repaid bank bailout money. They intend to use that to pay down debt. There’s a better way to use that money (which will pay down debt as well): Untie proposed launching a short-term emergency social housing programme – one that will finally eliminate homelessness and start to make inroads in the huge housing list.

This would have to be negotiated with the EU Commission – but this expenditure, being a once-off, wouldn’t impact on the structural deficit and, therefore, wouldn’t require derogation from the fiscal rules. It could be strengthened by the Dail declaring a Housing Emergency.

However, if you are proposing to sell of social housing, increase subsidies the home ownership sector, abolish the property tax – well, the idea of a housing emergency won’t be very credible. The over-riding issue is to build houses.

In the medium term we have to radically restructure social housing investment. Ireland is a European outlier when it comes to financing social housing. I have addressed this issue here. We need to move to a pluralist investment model; namely, like many other European countries we need to establish public housing associations which, while remaining in the broad public sector, would build houses on a commercial basis to keep the investment off-the-books.

This can facilitate, along with continued traditional state financing, a significant increase in social housing investment. Further, it can provide rental housing on a cost-rental basis (that is, rents that reflect building costs only) for low and average income earners; thus eroding the distinction between the public and private sector (you can read more about this here).

Lesson: maximise the public space from which we can both provide and invest in housing for all low-income people – not just ‘the poor’.

So that’s the start – workers’ rights, public-led enterprise and greater reliance on the public space for housing options. And all this with little impact on the fiscal space or Exchequer finances.

Indeed, to the extent that these promote business investment they can grow the fiscal space (through increased potential GDP). But more importantly, we can start talking about the economy – the economy of work and enterprise activity, and the resolution of one of our leading social crisis.

With that under our belt – now we can talk about fiscal space: resources for public services, for social protection (so that nearly half don’t have to live in deprivation conditions) and for investment. Because now we have sustainable economic growth, providing us more resources to meet these needs.

And all because we started with work, enterprise and homes.

Michael Taft is Research Officer with Unite the Union. His column will appear here every Tuesday. He is author of the political economy blog, Unite’s Notes on the Front. Follow Michael on Twitter: @notesonthefront

RollingNews

90395150Michael-Taft

From top: The coalition launch its capital investment plans, September 2015.. From left: Paschal Donohoe, Enda Kenny, Joan Burton and Brendan Howlin; Michael Taft

Ireland has the lowest level of public investment in the EU bar Malta and Bulgaria while just three companies account for 70 per cent of R & D investment.

Michael Taft writes:

Continuing the recovery? Starting the recovery (for those who haven’t started feeling it yet)? Protecting the recovery from outside events? What should we be doing?

Voices from the fiscal orthodoxy insist we should use the additional resources to pay down debt – as if a few percentage points are going to protect us from external events.

There are others that call for tax cuts but that’s a poor economic response whatever about its political appeal (which, if the Millward Brown poll is anything to go by, looks to have little popular appeal).

So how do we start, continue and protect recovery?

One word: investment. Investment is the driving force behind enterprise success, economic growth and social prosperity. Investment drives growth, increases productivity, enhances skills, reduces costs and puts business and the economy in a stronger competitive position. You want to be competitive? Invest.

The problem is that Ireland has a poor investment record. And no one is talking about this in the election campaign; therefore, no one is talking about how to address it (if you’re not aware there is a problem, it is more difficult to solve it). The fundamental driving force behind economic growth and i’ts nowhere on the agenda.

Historically, Irish investment has been below the EU average – even during the boom times.

The following looks at Irish investment excluding dwellings and intellectual property/R&D. The latter – a new category under Eurostat’s recently introduced ESA 2010 – is excluded simply because it inflates investment numbers without necessarily contributing to growth.

For instance, multi-nationals are re-locating IP activity into Ireland from tax haven locations. But to what extent this is making any real contribution to growth-generating activity is open to question.

In 2013, 70 percent of industrial R&D investment came from just three companies.

invest1

As seen, Ireland has been a consistent under-performer. Regarding investment prior to the boom, Davy Stockbrokers didn’t pull any punches.

‘Perhaps the greatest legacy of the bubble period of 2000-2008 is our road infrastructure. The value of our roads leaped from €13bn to €27.5bn. That accounted for almost 30% of the increase in our ‘core’ productive capital stock (i.e. capital stock excluding dwellings, retail and transportation / storage).

The reduction in journey times and greater certainty of planning have helped to significantly boost output per capita across the economy. But it is interesting to note that most of the rest of the increase in our core’ productive capital stock was related to the state or semi-state sectors. It was not driven by private enterprise.’

So what was private enterprise up to? As Davy points out, it mostly went into the unproductive housing and property sector.

But public investment, the driver in the past, is currently being suppressed. Ireland has the lowest level of public investment in the EU bar Malta and Bulgaria. And public investment levels are nearly 50 percent below historical trends.

The Government’s Capital Programme did nothing to correct this. Currently, public investment is 2 percent of GDP; by 2012 under the Government’s programme investment will be only 2.1 percent.

The above Eurostat data only takes us up to 2013. There is evidence of a rebound in 2014 as pent-up demand breaks through. But this is only a temporary phenomenon if the Central Bank’s projections hold up. The Central Bank is estimating a growth of nearly 20 percent in machinery and equipment this year but they expect this to fall back to 5 percent by next year.

It is fortunate that we have what Dr. Aidan O’Regan calls: ‘ a path dependent state-led developmental strategy to attract inward Foreign Direct Investment from large global firms in high-wage, high-tech service sectors.’

It has been this public agency driven strategy – and not austerity and structural adjustment – that moved us out of recession and into fast-track growth.

Were it not for this we would have to rely on the indigenous sector and this would not be good news at all.

invest2

The Irish indigenous sector – excluding the construction sector – ranks near the bottom of the EU tables when it comes to investment.

It was low starting out at the beginning of the recession. It is even lower now. Where there is some growth it comes from the spill-over impact of multi-nationals in the ICT sector.

This is not the stuff of campaign fireworks but it is the stuff of economic growth – poor overall investment, poor public investment and poor indigenous investment. It will not be easy to transform this.

Irish private capital has, for decades, been content to sink money into finance and property. Finding new routes into the productive sector will not be easy. But there are some headline proposals to consider:

First, substantially increase public investment to our historical level by 2021. This could mean an additional €8 billion to €12 billion in capital expenditure. Yes, I know – this is more than the fiscal space allows and doesn’t factor in the need to increase spending on public services and social protection. Short response: stop this tax cutting nonsense and start debating which taxes we will have to increase in order to raise public investment levels.

Second, drawing on the lesson from Davy Stockbrokers analysis, drive investment through public enterprise. This has the benefit of not impacting on government debt or the fiscal space. This will require strategies to create new public enterprise companies, expanding current ones and promoting partnerships with private sector companies (e.g. the ESB/Vodaphone partnership to roll out advanced broadband).

Third, redesign enterprise support programmes to privilege those companies committed to expanding investment –through in-kind supports and/or equity investment.

Investment is the key to starting, continuing and protecting recovery. This is the issue we should be debating – how much, where it should go and how it can be done. This would turn a desultory debate over tax cuts into an informed one based on growing the economy. That would be a debate worth tuning into.

Michael Taft is Research Officer with Unite the Union. His column will appear here every Tuesday. He is author of the political economy blog, Unite’s Notes on the Front. Follow Michael on Twitter: @notesonthefront

90407065-1

Michael-Taft

From top: Enda Kenny at government buildings this morning to convene his last cabinet meeting of this government term; Michael Taft

What many won’t say:

The road ahead is bumpier than you think.

Michael Taft writes:

So the economy is back in recovery mode but under the Government projections we are not going to bounce back to pre-recession levels of living standards.

Lower your expectations, sisters and brothers, the recovery is setting in. Let’s take a historical look at two indicators of living standards.

1) Consumer spending:

Between 1970 and 1995, a period covering two slump periods punctuated with growth, real consumer spending averaged 2.7 percent annually per capita.

Between 1995 and 2000 (the good phase of the Celtic Tiger, based on investment, manufacturing and exports), real consumer spending averaged 8.5 percent annually per capita. That was a strong performance, with employment rising, increasing wages and the ongoing shift to a modern enterprise base.

Between 2000 and 2007 (the bad speculative phase) real consumer spending averaged 3.4 percent per capita. A little better than the pre-Celtic Tiger period but as we know, unsustainable.

Then the recession hit and consumer spending fell by over 10 percent. However, as always happens, the economy recovered. In the textbook alphabet, there would be a burst coming out of the recession, representing pent-up demand, and then things would settle back down to past trends.

If the Government projections come true, this will not be the case.

1

We are in the middle of a bump which should continue into this year. However, the Government estimates that it will fall off rapidly in 2017 and remain below 1 percent into the next decade.

It is worth noting that while in 2015/2016 consumer spending increases by €1,000 for every man, woman and child, by 2020/2021 consumer spending increases by less than €300.

2) Public spending:

But this might not be so bad if the Government increased its spending on public services, or government consumption. If, for instance, the Government introduced affordable childcare, reducing fees by half, then the savings to the households could be redirected to other areas of consumption; similarly with free health care.

Let’s look at Government spending on public services.

Between 1970 and 1995, real government spending on public services averaged 2.8 percent annually per capita.

Between 1995 and 2000, real government spending on public services averaged 5.0 annually per capita.

Between 2000 and 2007, it rose by 3.1 annually in real terms.

Recession time and public service spending fell by 16 percent up to 2013.

So what is the government projecting going forward?

2

In 2014, government consumption rose by 4.2 percent but this was largely a statistical fluke, factoring in productivity gains from the Lansdowne Agreement. In subsequent years there is effectively no increase at all.

Therefore, there are three principles that should guide the next government.

First, investment; driving investment increases productivity and enterprise expansion which, in turn, increases wages and employment. This is a more sustainable approach to consumption. Pumping consumer spending through tax cuts in the hope that this will increase investment (through business confidence, etc.) is misplaced – as Michael Burke shows here. Pumping consumption in a small open economy like Ireland’s is even more problematic; without stronger export growth, this can lead to reduced growth due to imports.

Second, prioritise public services over tax cuts. If the state provides free healthcare, this reduces costs for many households which can redirect the saving into other areas. It also makes this service more accessible to people who otherwise couldn’t afford costs in the private market. This makes for a more equitable approach to consumption.

Third, redistribute: if you take €100 million from higher income groups and redirect it to low income groups, consumer spending will rise as the latter spends almost everything they get. Therefore, prioritise income supports for those out of work and the low-paid.

There is rising uncertainty in European and international markets. If anything can see us through this, it is a programme that focuses on our economic infrastructure, provides services collectively (reduced cost, greater participation) and promotes income equality. This is a long-term approach.

Right-wingers, Fine Gael in particular, are proposing to reduce our tax base while starving economic and social investment.

If this short-termist, electorally-populist formulation isn’t a recipe for instability it is hard to know what is. And as a set of policies designed to enhance living standards, it is a bust. Progressives should put forward a different, more economically responsible programme.

Investment, public services and equality: how’s that for a campaign theme?

Michael Taft is Research with Unite the Union. His column will appear here every Tuesday. He is author of the political economy blog, Unite’s Notes on the Front. Follow Michael on Twitter: @notesonthefront

90347179Michael Taft

Last year’s Dubai Irish Derby, Curragh, Co Kildare ; Michael Taft

The recovering economy will lift all boats, we are assured

But beneath the surface all is not well

Michael Taft writes:

The economy is in strong growth, but if polls are anything to go by most people are not feeling the breeze. As Goodbody economist Dermot O’Leary says:

‘While people broadly accept that the country is better off than a year ago, a large majority believe that it has not yet benefited them personally. One recent survey suggested that only 15pc of people feel that they have personally benefited. Trickle-down economics appears to be clogged up.’

For many this will change over the coming months. Employment is rising, wage increases are occurring. However, social protection payments, with the exception of pensions, have been largely frozen (that is, they have been cut in real terms) and there is some evidence that wage increases are primarily going to managers and professionals.

The CSO shows that in the last two years, weekly income for managers and professionals increased while all other employees (sales, clerical, service, production, building and transport workers) saw their weekly income fall.

Trying to nail down the ‘who is benefitting’ numbers from the data can be difficult, as in many cases it lags by a year or two and in other cases it doesn’t exist. So we have to go about connecting-the-dots.

With the help of Seamus Coffey’s useful post on household income, we can make a start. This tracks the rise of household disposable income by comparing the first nine months in each of the last four years.

Seamus’s full table can be found here; what follows shows the increases in the main income categories.

Clogging Up the Trickle Down 1

Total household income rose by 16 percent over the last four years. Employee income rose by 7 percent, while total self-employed income rose by over a third.

Net property income – mostly dividend income according to Seamus – nearly trebled, though this is a small category.

Another way of looking at the data is:

In the last four years, employees received 32 percent of the total rise in household income (in the last year it made up 28 percent)

Self-employed took 46 percent of the rise in income (54 percent in the last year)

Net property income accounted for 22 percent of the rise in income (18 percent in the last year)

Clearly, it is self-employed income that has been the main beneficiary of the rise in total income. Who accounts for this? Farmers, professionals (doctors, lawyers, consultants), craft workers? The data is silent. Nor, from this table, do we know how the increases are distributed among different income groups.

Let’s turn to another dataset – the Survey of Income and Living Conditions (SILC). This cannot be overlaid on the above data which is taken from the national accounts – different methodologies, slightly different categories. The data from SILC refers to equivalised income – that is, it takes account of how many people are living in the household.

However, we can get a sense of who is benefitting (the CSO didn’t publish the 2011 data, and 2015 will come on stream later this year).

Clogging Up the Trickle Down 2

What is this table telling us?

Of the increase in all direct income (direct income excludes social transfers), the top 10 percent income group took nearly 47 percent.

Of the increase in employees’ income (wages and salaries), the top 10 percent took nearly a third of the total increase in employee income.

Regarding self-employed income, the top 10 percent took 77 percent of the rise.

And 55 percent of the total increase in Other Direct Income (in SILC this refers to interest, dividends, rent and private pensions) went to the top 10 percent. It would be reasonable to assume that increases in employee income are more widely distributed among different income groups; less so for self-employed and other direct income.

So let’s summarise:

Household income is increasing. In the last year it jumped by 8.5 percent. However, over 50 percent of this rise was taken up by the self-employed with another 18 percent going on net property income.

Within the self-employed, SILC shows that the main beneficiaries are the top 10 percent; ditto for other direct income like dividends and rent.

So we have a clear and substantial rise in overall household income. However, when we look below the surface we find evidence (not necessarily conclusive evidence but certainly persuasive) that most of it is landing in the pockets of the self-employed and capital/private pension income – and most of that is landing in the pockets of the top 10 percent.

Maybe that’s why people are not feeling it. Because the money is not heading in their direction; nor is there any uplift in social transfers.

In any recovery boats lift at different times and at different rates. That’s why in the upcoming election it’s not enough to learn about what parties will do about growing the economy.

Just as importantly, we need to learn how they are going to spread that growth around, how they are going to ensure that all boats are lifted; and what special attention they will give to the many, many small boats that are in bad need of repair.

Otherwise the economic pond will be dominated by a few big boats which will sail right over the rest of us.

Michael Taft is Research with Unite the Union. His column will appear here every Tuesday. He is author of the political economy blog, Unite’s Notes on the Front. Follow Michael on Twitter: @notesonthefront

1percent_facebook_en-24_0Michael Taft

From top: Oxfam warning 2014; Michael Taft

The recovery is benefiting one tiny group above all others.

Michael Taft writes:

The One Percenters are back in the news with an Oxfam study showing that the world’s richest 1 percent owns more wealth than all the rest of the planet put together.

So what about our own One percent? How are they doing? Let’s have a look at how that 1 percent and other top earners have been getting along in the crisis.

What follows is based on the EU’s Survey of Income and Living Conditions measurement of income. It is a different concept from what Oxfam used: wealth. Wealth ownership refers to assets – real estate (buildings, land) and financial property (shares, bonds, cash, equities, pension pots, etc.). Income refers to the annual flow, whether it is employee or self-employed earnings, investment income, pensions, etc.

Income is only one measure of economic power and influence in the economy. Profits levels, the relative strength of labour and capital, degree of financialisation, place in the production process, social status, ownership of assets – it could be argued that income is the result, not the cause, of unequal power relationships in the economy.

But it’s an informative measurement and can reveal something of what is happening around us or, in this case, above us.

1

Prior to the crash the top 1 percent held nearly six percent of the share of national income, above the EU-15 average. This fell to 2011 – primarily due to losses in capital and self-employment income arising from property and speculative losses in the crash.

However, since 2011 (and the current government), things are on the mend with the 1 percent trending upwards. Still a ways to go to pre-crash levels but with a little time and a few tax cuts, normal business should be be resumed.

There are other ‘tops’ we can look at.

2

All the top percentages are experiencing a recovery and are returning to pre-crash levels.
Of course, the situation at the bottom is still pretty bottom.

The lowest 20 percent have only an 8.3 percent share (compared to 39.1 percent at the top)

The lowest 10 percent have only 3.2 percent share (compared to 24.4 percent at the top)

The lowest 5 percent have only a 1.1 percent share (compared to 15.1 at the top)

And the lowest 1 percent? It is so low that it is represented in the Eurostat tables as 0.0 percent.

There are many who would see these figures and the first thing they reach for is the tax axe. There’s something to that. Redistribute €250 million from high income groups to low income groups and watch consumer spending, business turnover and GDP rise.

But there is far more to inequality than just income. If there is affordable childcare, I may be able to take up a job or increase my working hours; otherwise I can’t afford the private fees. If I get sick, I may have to wait in a queue because I can’t afford queue-jumping insurance or private health fees. If public transport fees fall, I have more to spend. Public services are vital – not only in order that people can have access to services they might not otherwise, but that access doesn’t leave a further hole in the pocket.

There is also labour power. Giving people in the workplace stronger rights (right to collective bargain, part-time workers’ right to extra hours, statutory Sunday premium and overtime pay, extension of statutory collective bargaining) pushes up wages, especially the low-waged, and bridges the gap between the highest and the lowest by raising the floor.

Then there’s freedom of economic information to allow for a social monitoring of widening gaps. Full business accounts disclosure, including executive remuneration; and the gap between executive and average pay in the firm will allow society, consumers and investors to monitor enterprise performance and take decisions accordingly.

There are many strategies we can pursue to produce more egalitarian outcomes. Failure to do so will facilitate the acquisition of more power and resources at the top.

So, how’s the ol’ One percent doing? They went through a bit of a rocky patch but they’re back on the mend. Unless we take steps.

Michael Taft is Research with Unite the Union. His column will appear here every Tuesday. He is author of the political economy blog, Unite’s Notes on the Front. Follow Michael on Twitter: @notesonthefront

90404823image

From top: Enda Kenny and Joan Burton at government buildings yesterday; Michael Taft.

Taoiseach Enda Kenny plans to move Ireland ” to US levels of income tax”.

So what does he think we have already?

Michael Taft writes

Ireland already has a US-style taxation system – if we use general government revenue as the benchmark.Before the crash Ireland was awash with revenue from the speculative boom; revenue that quickly evaporated. Since then, Irish government revenue has been steadily falling.

graph

The graph (above) is what the EU Ameco [the annual macro-economic database of the European Commission’s Directorate General for Economic and Financial Affairs] database tells us:

By 2017:

The Government projects revenue will be below 32 percent of GDP. When we factor in multi-national accountancy practices, this figure rises to 34.5 percent

Ameco projects that US revenue will be 34 percent

Ameco also projects that Eurozone revenue will be over 46 percent.

A few things stand out in this. First, we are already at low US low-levels of taxation. Second, we are certainly not at European norms. We’d have to raise taxation by a mind-boggling €26 billion to reach the Eurozone average.

Even with the demographic benefit of having fewer elderly (which is substantially negated by a higher level of young people) we’d have to increase taxation massively.

Third, the Government projections foresee revenue falling even further out to 2021 when it will be below 34 percent.

And here’s the kicker: this doesn’t factor in tax cuts that a future government may introduce. For instance, Fine Gael wants to abolish USC. That will drive tax revenue down further, potentially falling behind US levels.

When measured as a percentage of GDP, Ireland is at the bottom of EU tables – fighting it out with Romania and Latvia for the rock bottom prize. Nods towards quality health and education services, childcare and eldercare, public transport, pensions and incomes supports are made, but these are little more than nods; perfunctory gestures in a debate that effectively excludes the social.

What the Taoiseach really wants is for Ireland to be a basement-without-a-bargain economy where public resources are squeezed, investment is starved, and the energy bulb frequently cuts out without any window to let in the light.

Michael Taft is Research Officer with Unite the Trade Union. His column will appear here every Tuesday. Follow Michael on Twitter: @notesonthefront