

Tag Archives: taft on tuesday

redcow

Michael-Taft

From top: The Red Cow Interchange; Michael Taft

Excluding construction, only 6,700 jobs were created outside Dublin in the last year.

Michael Taft writes:

Some commentators have recently challenged the assertion that there is no recovery outside Dublin.

Dan O’Brien does up the numbers and show, with the exception of the West and recently the Mid-East, jobs growth has been robust outside Dublin. Stephen Kinsella made a similar point in a recent Sunday Business Post article.

What they point out is correct.

However, I want to look under the hood and see in what sectors jobs are being created.

In this post I will focus on the market economy. This is essentially the private sector which contains almost all traded sectors (that is, almost all sectors that trade internationally).

This excludes non-market sectors: public administration, education, health, arts/leisure and the agricultural sector. These are called non-market because of their high reliance on public sector activity or public subsidies. There are few traded goods and services in this sector.

What is the breakdown between Dublin and outside Dublin when it comes to the market economy?

Let’s first look at the total economy – both market and non-market sectors.

1

Over the last four years there has been more job creation outside Dublin than in the capital city (though we have to remember that the CSO undertook an adjustment in their sampling base which saw agricultural employment adjusted upwards significantly, though it didn’t necessarily rise in the economy).

In the last year, however, Dublin has benefitted from most of the job creation in the state – 57 percent of the jobs created were in Dublin.

2
When we turn to the market economy, however, a different story emerges.

Whether in the last four years or the last year, Dublin has generated approximately two-thirds of jobs in the market economy.

Outside Dublin, even though 70 percent of the total labour force resides there, only a third of jobs were generated. That is a severe imbalance.

Let’s drill down one more time and examine the amount of job creation excluding construction. This is not to suggest that construction isn’t an important sector; and after the hit this sector took in the recession there will be a rise as the recovery sets in.

But over-reliance on construction, as we know to our cost, is unhealthy.

At the height of the boom – 2007 – construction employment made up 13 percent of all market economy employment in Dublin; outside Dublin it made up over 21 percent.

3

When we exclude construction, Dublin has generated 80 percent of jobs in the market economy – leaving the rest of the country well behind.

Let’s put an actual number on this. In the last year only 6,700 jobs were created outside Dublin in the market economy when we exclude construction. Let’s run through the sectors this includes:

Mining * Manufacturing * Utilities * Wholesale & Retail * Transport & Storage * Hotels & Restaurants * Information & Communication * Financial Services * Professional, Technical & Scientific * Administrative and Support Services

In all these sectors only 6,700 jobs were created outside Dublin last year. That’s not a great trend even if it is heading upwards in the last year.

And this is outside Dublin – not an urban/rural divide.

Outside Dublin there are large urban areas such as Cork and Galway and substantial city/towns such as Drogheda and Wexford.

We don’t have the data available to breakdown how much job creation is occurring in strictly rural areas but it is reasonable to assume that it is proportionally lower than larger cities and towns.

In other words, we may be seeing an actual decline in the rural areas leading to higher unemployment, emigration (internal and foreign) or withdrawal from the labour force. This, combined with an ageing population and lower birth rates, could spell trouble for large swathes of the country.

None of this is surprising. Market-led job creation will see a trend towards urbanisation as capital and labour are drawn to clusters (IFSC and digital companies) and areas of better infrastructure such as telecommunications.

If the Government is serious about a rural or regional strategy it will have to mobilise capital and enterprise activity through public sector mechanisms, which is not the same as the public sector.

There is only so long an area or region can rely on non-market services and construction.

However, if the Government relies on grants and tax incentives and ‘enterprise zones’, to grow rural economies they will be disappointed; the problem is that there is less and less capital to incentivise in these areas.

We will continue to see many areas outside Dublin lag the capital city and other major urban areas.

And this will be costly affair – both in terms of public resources; but most of all, the large scale squandering of national and regional assets.

Michael Taft is Research Officer with Unite the Union. His column appears here every Tuesday. He is author of the political economy blog, Unite’s Notes on the Front. Follow Michael on Twitter: @notesonthefront


Payslip_large
Michael-Taft

From top: Salary payments; Michael Taft

Most of the income increase over the last five years has been concentrated among higher-income groups

Michael Taft writes:

In a previous blog I discussed the issue of who is benefiting from income increases, using national accounts and the Survey on Income and Living Conditions.

Here’s another look at the issue, this time with the assistance of the CSO’s Earnings database, focusing on wages. This will give us another, potentially more provocative, look at the issue.

That wages are rising is not in doubt.

Since wages (average weekly earnings) bottomed out in 2011,there has been a growth of 7 percent in the private sector while public sector wages have flat-lined. This has resulted in an economy-wide growth of 3 percent.

We always have to be aware of the compositional effect, though – a change in the composition of the group you are measuring.

Here is a simple example: we are measuring the average income of all customers in the pub.There’s 10 customers (slow night) and they have an average income of €36,000.

Then a millionaire walks in. We measure the same group – all the customers of the pub; but now the average is substantially higher. The original 10 customers haven’t experienced any change in income; it’s just that the composition of the group we’re measuring has changed.

So the 7 percent increase in private sector weekly earnings doesn’t mean every worker received that wage increase – more jobs created in in high income sectors (financial, information & communication) will change the composition.

With that caveat, let’s proceed to the next measurement.

The CSO measures average weekly earnings of three types of employees:

Mangers & Professionals: this includes associated professionals
White-Collar Employees: this includes clerical, sales and service employees
Blue-Collar Employees: this includes production, transport, craft and other manual workers

How have these two groups fared?

graph

Managers & professionals have been big gainers – over €100 per week, or nearly 10 percent increase. All other employees, however, have seen their weekly incomes fall. Even if with a compositional effect, its’ a significant difference.

There are some differences when we look under the hood. In the industrial sector (manufacturing, utilities, and mining), the three groups experience similar increases with managers & professionals receiving a 11 percent increase, white-collar workers receiving a 10 percent while blue-collar workers received a 14 percent increase.

However, the rest of the economy brings down the average of the latter two groups.

Rooting under the hood some more here’s another interesting finding: the Information and Communication sector makes up 3.9 percent of all employees in the economy. Yet this sector accounted for 21.2 percent of the entire increase in average weekly earnings.

This shouldn’t be too surprising given the number of multi-nationals in this sector that have located and expanded here in the last five years. Still, it gives evidence of the concentration of earnings.

What does all this mean? Even with a compositional effect, it shows that most of the income increase over the last five years has been concentrated among higher-income groups.

Here are the annualised average earnings for the three categories of workers in the first quarter of this year:

Managers & Professionals: €62,300

White-Collar Employees: €24,500

Blue-Collar Employees: €26,100

Again, we have to mindful that, especially among service workers (e.g. hospitality), some of this difference can be accounted for by less working hours.

We can’t say how much because the data doesn’t provide earnings per hour or working hours; we can’t produce full-time equivalents.However, Information & Communication employees earn nearly three times the hourly wage as hospitality workers – even more of a gap than the annualised earnings above.

Bottom-line: earnings inequality is growing in the economy. This may not mean much if you don’t think inequality is a problem.

However, if you think rising inequality will result in economic inefficiency and social erosion then you should be concerned. Very concerned.

Michael Taft is Research Officer with Unite the Union. His column appears here every Tuesday. He is author of the political economy blog, Unite’s Notes on the Front. Follow Michael on Twitter: @notesonthefront

 

Waiter-carrying-serving-tray
Michael-Taft

From top: waiter carrying tray: Michael Taft

How can we generate economic wealth and create well-paying jobs if indigenous business is over-concentrated in the low paid hospitality and retail sectors?

Michael Taft writes:

Here is one part of a presentation I made to the Nevin Economic Research Institute’s Labour Market Conference held earlier this month in the University of Limerick.

This may seem a bit abstract; it certainly doesn’t seem as urgent as other issues such as health or housing. However, this has far-reaching implications for long-term economic growth, household prosperity, and business competitiveness.

There is a narrative about Irish indigenous enterprise (which I shall simply refer to as Irish business) which has been championed by many, notably Dr. Conor McCabe, that Irish business and capital has historically focused on the finance and property sectors, content to service foreign-owned capital but which has, with some exceptions, avoided the high-value added sectors upon which we could build a strong Irish export base.

The following adds to this analysis by analysing what market sectors Irish business is active in.
Market sectors exclude agriculture and ‘non-market’ service (e.g. public administration, health, education, recreation & leisure).

1

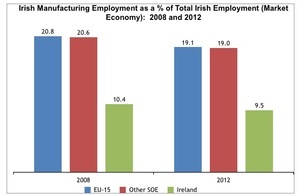
The chart (above) compares Ireland with the EU-15 and our peer group – other small open economies which, like us, have small domestic markets and are reliant on exports.

Irish business is a poor performer when it comes to manufacturing. Whereas one-in-five European workers in the indigenous sector are employed in manufacturing, it is only 10 percent here.

Unfortunately, the EU data is, so far, limited to the period between 2008 and 2012 so we are looking at many countries at the bottom of the business cycle, especially Ireland. Still, Irish manufacturing is weak.

Why should this matter – if we can excel in other sectors? Professor Ha-Joon Chang puts it this way:

‘. . . the manufacturing sector is still – and will always be – the main source of productivity growth and economic prosperity. It is a sector that is most open to the use of machines and chemical processes, which raises productivity. It is also where most research and development, which generates new technologies, is done.

Moreover . . . it raises productivity in other sectors, mainly because the services sector is using more advanced inputs produced in manufacturing– computers, fibre-optic cables, routers, GPS machines, more fuel-efficient cars, mechanised warehouses and so on. Knowledge-intensive services sell mostly to manufacturing firms, so their success depends on manufacturing success. ‘

Manufacturing’s contribution to the Irish economy is, per employee, considerable.

Using Forfas data – which is based on exporting companies – direct expenditure in the manufacturing sector (total wages plus Irish materials and services purchased) came to €170,000 per employee. In contrast, direct expenditure in the traded services sector was €93,000 per employee.

Manufacturing has an 83 percent higher impact in the economy per employee.
Unfortunately, the total size of the Irish manufacturing is small which limits this benefit.

However, there are other sectors where Ireland performs strongly – and these, unfortunately, are sectors which are low-wage and low value-added.

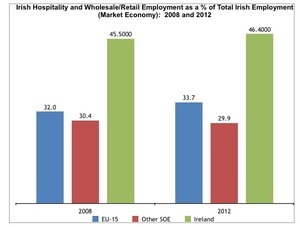
2

Irish levels far exceed the proportion in other European countries. Indeed, over 17 percent – or more than one-in-six – in Ireland are employed in hotels and restaurants.

While it is understandable that this sector would be higher than our peer group (such as Finland) given greater tourist numbers, there is an over-concentration in Ireland.

For instance, Spain, Greece and Italy all have higher levels of tourism as measured by nightly accommodation occupancy per capita, than Ireland (between 11 and 21 percent higher), they have between 9 and 12 percent of their total market employment in working in the hospitality sector.

Compare that to Ireland’s 17 percent.

This concentration in employment is mirrored in business investment. In the EU-15, investment in the combined hospitality and wholesale/retail sectors makes up 15 percent of total indigenous investment; in other SOE countries it makes 12 percent. In Ireland it makes up 20 percent (in 2008, it made up 25 percent).

Here’s a little factoid to chew on: in 2008, there was more Irish investment in the hospitality sector than in the manufacturing sector.

This raises important questions.

How can we generate economic wealth (e.g. value-added) if indigenous business is over-concentrated in the hospitality and retail sectors? How are we going to generate well-paying jobs, given these sectors are low-paid? How are we going to build a strong Irish export platform as distinct from the modern, foreign-sector?

It also raises questions regarding the Living Wage.

It is easier to introduce a Living Wage in an economy where the traditional low-paid sectors make up a smaller proportion of the indigenous sector; where any price rises can be absorbed by consumers working in higher-paid sectors such as manufacturing. It is harder when those low-paid sectors make up such a high proportion – approaching 50 percent – of total employment as it does in Ireland.

We hear a lot about Irish business – which is sometimes conflated with foreign-owned firms.

We hear claims that the indigenous needs better tax treatment (a corporate tax rate of 12.5 percent isn’t good enough? Employers’ social insurance at half the level of other EU countries isn’t good enough? ).

We read stories about Irish entrepreneurs.

What we don’t get is a fact-based analysis of the state of Irish business –that it is concentrated in low-paid, low-value added and – in the case of wholesale/retail – non-traded, or non-export, sectors.

Hopefully, the incoming Minister is aware of this flaw. Hopefully.

Michael Taft is Research Officer with Unite the Union. His column appears here every Tuesday. He is author of the political economy blog, Unite’s Notes on the Front. Follow Michael on Twitter: @notesonthefront
funeralMichael-Taft

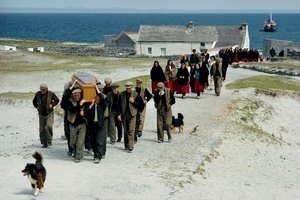
From top: funeral procession, Inisheer Island, Aran Islands, Co Galway, 1968; Michael Taft

Raising the inheritance tax threshold will have no impact on a significant majority of households.

Michael Taft writes”

The Programme for Government has provision for cutting inheritance tax. This is bleak business. Cutting inheritance tax will be a bonanza for high-income groups.

Welcome to the new politics, inseparable from the old politics.

The Government proposes to increase the tax-free threshold from the current €280,000 to €500,000. The regressive impact can be seen from this simple example. I inherit €500,000. Currently, I would pay 33 percent on the amount exceeding the threshold; that is €220,000.

My tax bill would be €72,600. That is an effective tax rate of 14.5 percent. That’s not a bad deal (and arguably already too generous): I inherit half-a-million Euros and keep 85 percent of it after tax.

Under the new proposals, I would pay nothing.

There are many arguments for cutting inheritance tax but the most unimpressive is that it would somehow benefit low and middle income earners.

The fact is that most people don’t have even the current threshold to give away in an inheritance.

The median net wealth (wealth after debts) for those aged over 64 years is €202,300. This means that 50 percent of this older-age group has net wealth less than this amount.

That includes both financial and real (property) wealth. It is reasonable to assume that a significant majority have net wealth holdings of less than the current threshold of €280,000. Of course, not all disponers come from the older-age group but probably a majority does.

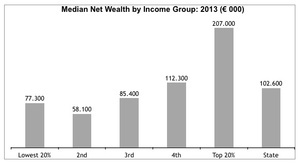
When we look at the national numbers we can get data on income distribution. The following table shows the median net wealth by quintile – or tranches of 20 percent.

1

The top 20 percent income earners have a median net wealth of €207,000 (again, meaning half of this group have a wealth of less than this amount). T

hroughout the state, half of all households have a net wealth holding of less than €103,000. [Note: the lowest income group has a median net wealth holding higher than the 2nd quintile; this can be explained by the fact the lowest group would contain older age groups reliant on state pensions but own their houses).

Based on this, it is reasonable to assume that raising the inheritance tax threshold will have no impact on a significant majority of households.

Even if a household has a much higher level of wealth than the average, raising the thresholds may have little impact. I may pass on €500,000 on an inheritance but if I divide it equally between my two children, then they won’t be liable to tax under the current threshold.

Some argue that the gift/inheritance shouldn’t be taxed because it has already been taxed. This is debateable for two reasons. First, it is taxed in the hands of the recipient who, by definition, is only receiving it for the first time. Second, income is subject to multiple taxes (or double/triple, etc. taxation). I pay income tax on my wage.

But I also pay USC on my wage; and PRSI. After tax, I continue to pay taxes – VAT, excise taxes, levies (ATM withdrawals, etc.). And the after-tax income that I spend in the shops is also subject to taxation; corporate tax for the business and income taxes for the employees. And so the cycle continues.

Still others have referred to the situation whereby a son/daughter inherits a house – but is forced to sell the ‘family home’ to pay the tax bill. Is this just anecdotal?

I receive a house in an inheritance. If I already own a home, I have inherited a second home (adding substantially to my wealth). I can either rent out the house, earning income; or I can sell it. Either way, I receive a substantial gain – even after the tax bill.

If I rent, I can move into the house with full equity and increase my income through reduced rent payments. The tax bill is a once-off, my rent reduction is permanent. This is not to say there are not issues regarding inheritances and payments – I look at some of them below. But gaining a house through inheritance is a gift of a substantial asset.

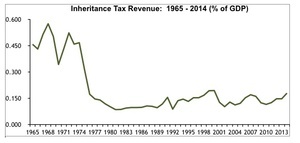
The cut in inheritance tax is estimated to cost €75 million, not a trifling sum. However, the real issue is that ever since estate duties were abolished and replaced by the Capital Acquisitions Tax, inheritance tax revenue has been subdued.

2
There is a strong argument for an increase in inheritance and gift taxes, especially give these tight fiscal times.

This argument gains force when we consider that this is a tax on unearned income. We tax unearned income so that we don’t have to impose that amount on earned income – a PAYE wage or the income of the self-employed or a business.

Economic efficiency would see higher, not lower, taxation on unearned income.

There are three issues that could be considered in the context of a more progressive inheritance tax regime.

First, is the issue of inheriting a house; currently, there is an implication that a child who is living in the ‘family home’ can only inherit tax-free if the parent is not living in the house (in other words, the parents have two houses).

There are exceptions for those caring for a parent. If there is a problem in this area it should be cleared – so that a child living in the house, with conditions, is not barred because they share the house with the parent.

Second, consideration should be given to extending the situations whereby the inheritance tax can be paid over 60 months.

Third, prior to 1999, there are varying rates for inheritances – ranging from 20 percent to 40 percent. This added a progressive element to the tax. Reintroducing a low rate and top rate could also be considered.

But if we entering into an era of ‘new politics’ then the Government should bring forward evidence as to the distributional impact of cutting inheritance tax – who will gain and by how much?

Is this a transfer to high-income groups from the rest of us?

In any event it will be interesting to see how the Government squares this commitment to cut inheritance tax with a commitment in the Government programme to poverty-proofing new policies.

I suspect it can’t be done.

Michael Taft is Research Officer with Unite the Union. His column appears here every Tuesday. He is author of the political economy blog, Unite’s Notes on the Front. Follow Michael on Twitter: @notesonthefront
Pic: James Sugar/National Geographic

90286109Michael-Taft

From top: Social welfare office, Thomas Street, Dublin; Michael Taft

No one group has suffered more.

So why is no one talking about restoring the cuts to social protection?

Michael Taft writes`;

Why isn’t this on the agenda? Why are so few talking about it (one exception is Unite the Union, there are other civil society groups in this conversation, too)?

We hear a lot about repairing the social damage, paying back those who made sacrifices during the recession. So why is no one talking about restoring the cuts to social protection?

In 2010 and 2011 basic social protection payments were cut by 8 percent – from a basic rate of €204.30 to the current €188. In addition, inflation has taken its toll, so the loss in real terms is higher. But in the last two budgets taxes were cut while basic social protection payments were left untouched.

If you’re looking for people who suffered during the recession you’ll find most of them reliant upon social protection payments.

taft1

Over half of unemployed, single parents and those unable to work due to illness or disability suffer multiple deprivation experiences.

For single parents reliant on social protection payments, the figure is probably higher than 59 percent as this category would also include single parents in the workforce, many of whom would not suffer deprivation.

Yes, we must get the unemployed back into work but even by 2021, the Government expects unemployment to be 6 percent.

Yes, we must devise programmes to get many of those suffering from disability into the workforce as well but we have a long ways to go – Ireland has the lowest level of employment among this group (bar Bulgaria and Hungary).

And we need to help single parents back into the workforce (a national network of affordable childcare would help in this regard).

We must be doing all these things – but in the meantime, we shouldn’t be consigning a huge swathe of the population to poverty and deprivation.

How much would it take to reverse the costs? In January of this year, the Social Protection Minister puts some numbers on this. Based on this, it would cost close to €800 million to restore social protection payments to their nominal 2009 level (including restoring the cuts to youth Jobseekers’ Allowance).

It would cost approximately €1.2 billion to restore these payments in real terms (factoring in inflation).

If this seems like a lot, remember – this is only about restoring the 2009 status quo. It would still mean stagnation since then.

Is this affordable?

The new Government intends to spend €3.5 billion on tax cuts up to 2021. There is an additional €€2 billion tucked away under the fiscal space radar for ‘tax indexation’; that is, tax cuts.

So there is some money about if you think that trying to lift people some ways out of poverty and deprivation is important.

Yes, poverty is about more than just cash transfers. There’s work and personal skills, access to public services, education and health status. But it’s also about income.

It’s not as if this money will go down some black hole. By and large it will be returned back to the economy through higher consumer spending which means more money in the tills and cash registers of businesses throughout the country (low-income groups have low propensities to save).

If this doesn’t sound too unfeeling, people on low-incomes are demand-conduits; what goes into one pocket, goes out of the other into businesses and their workforce. This is all the more the case given that low-income groups’ consumption is less import-dense – they spend less abroad, or on new cars, champagne or other imported items than the rest of the population.

But at the end of the day, you prioritise according to your political values (economics is not science, it’s politics).

If you believe that poverty and deprivation is a stigma on society, a social obscenity, and an avoidable outcome, you will prioritise those who are having trouble making ends meet.

This includes those reliant on social protection, those on waiting lists (housing, health), the homeless, the elderly living in isolation, those mired in arrears, the child in need of special education, the carer in need of help with their disabled relative.

The list is not endless but it is substantial. We can fashion our economic (political) and social priorities in a way that helps, assists, supports.

And if we do that, we will find that we are all better off.

We are not self-aggrandising units of consumption. We live in society, participating in a dense network of social relations. When some of those relations are mired in poverty and deprivation, it degrades all of us.

So let’s start – even if it is a small start – to build a better society. Let’s start restoring social protection payments.

Michael Taft is Research Officer with Unite the Union. His column appears here every Tuesday. He is author of the political economy blog, Unite’s Notes on the Front. Follow Michael on Twitter: @notesonthefront
Rollingnews

90417016
Michael-Taft

From top: Fine Gael’s government formation negotiating team, from left: Paschal Donohoe, Leo Vardakar, Frances Fitzgerald and Michael Noonan in Trinity College Dublin last week; Michael Taft

Do we really want to follow a Tory model of low-spend?

Don’t be surprised to see loss of competitiveness, poverty, inequality and poor public services dominate the headlines over the next few years.

Michael Taft writes:

We are potentially heading down a dangerous stretch of road ahead – leading us into the Ultra-Low spend zone.

In this zone, investment declines and, so competitiveness and productivity; health and education services suffer; income supports falter adding fuel to the inequality engine.

A low-service, low-waged, low-productivity future awaits.

Of course, spending a lot of money doesn’t guarantee you optimal results. But spending too little certainly won’t get you optimal results.

So how far behind are we falling? Let’s compare public spending (excluding interest – this is called ‘primary’ expenditure) in the EU-15 countries.

I’ll use the method devised by Seamus Coffey who hangs out at Economic-Incentives. He excluded elderly-related expenditure and then compared Ireland with the rest of Europe.

He did this because Ireland has an advantage here – we don’t have to spend as much on pensions and related expenditure because we have a smaller proportion of elderly.

In the EU-15, the over 65 cohort makes up 19 percent of the population; in Ireland, this cohort makes up 13 percent. 2014 is the latest year we have data for old-age expenditure.

In the following, old-age expenditure is subtracted from total primary spending. For instance, Ireland spent 37.2 percent of its adjusted GDP (adjusted per the Irish Fiscal Council’s hybrid-GDP estimate that factors in the accounting practices of multi-nationals).

It spent 4 percent on the elderly, leaving an expenditure level of 33.2 percent excluding elderly-related spending. Figures for European categories are mean averages.

1


Ireland ranks below all the European averages. What difference would it have made in 2014 in actual Euros and cents?

To reach the average of other EU-15 countries, we would have had to increase public spending by €6.5 billion.

The next comparison is with other Northern and Central European economies (other NCEE). This is the EU-15 excluding the poorer Mediterranean countries like Greece and Portugal. To reach this average, we would have had to spend an additional €9.6 billion.

The final comparison is with Other Small Open Economies, a category used by the IMF. These are economies with a small domestic market and a high reliance on exports. Austria, Belgium, Denmark, Finland and Sweden are in this category. This is arguably our peer group.

To reach this average we would have had to spend an additional €15.5 billion.

[Note: some will say that defence spending should also be factored in as other European countries spend more than us. This is true. In the EU-15, defence spending makes up approximately 1.3 percent of GDP; it’s 0.4 percent in Ireland. In any event, defence spending is a policy choice and, in my opinion, shouldn’t be excluded from comparisons. But if you insist, knock off about €1.5 billion off the numbers above.]

In 2014, it could be argued that we are already a low-spend economy but as I wrote here, the situation could actually be worse. I have reservations about Seamus’s method. Excluding old age expenditure not only removes the demographic driven part of overall spending, it removes policy choices.

Most other EU-15 countries spend more on elderly per capita than we do. Second, if we are to adjust for the elderly population, then we should also adjust for youth demographics. In Ireland, under-20s make up 28 percent of the population, compared to 21 percent in the EU-15.

And we are a low-spender when it comes to education. EU-15 countries spent 5.3 percent on education, Ireland spent 4.7 percent. We have a third more children than the EU-15 and spend more than 10 percent less.

Therefore, when these are factored in, I fear we will have fallen even further behind. But let’s stick with Seamus’s method. Besides, those calculations above were then and we are heading into an even worse situation. Let’s fast-track to 2021.

Here, I use the IMF estimates. There are certain assumptions we will have to make. First, that the interest expenditure throughout the EU-15 – 1.5 percent – applies to each country (it won’t but it will average out). Second, that expenditure on old age remains constant. This will almost certainly change but in all likelihood, spending will increase in Ireland faster than in the rest of the EU-15.

The 2015 Ageing Report estimates that the number of pensioners over 65 years will increase by 17.5 percent in Ireland between 2013 and 2020 compared to a growth rate of 10.9 percent.

We will still have a demographic dividend but the higher growth rate will result in higher spending. And we will have more students in 2020 while the number of students in Europe will fall. So, if anything our demographic driven spending will rise faster.

Third, we assume that 75 percent of the fiscal space will devoted to public spending, or €8 billion. So what is one possible future, based on the IMF estimates?

2

By 2021 spending in Ireland collapses, falling well behind other European averages.

To reach the average of other EU-15 countries in 2021 we will need to increase spending by €21.2 billion.

To reach the average of other Northern and Central European economies, we will need to spend €24.4 billion.

To reach the average of other small open economies, we will need to increase spending by an incredible €33 billion.

These should be treated as indicative as they are based on assumptions and estimates. Will other EU countries increase or cut spending? Will spending on old age rise faster or slower?

However, we do know from the Government’s own projections that primary spending will fall from 34.2 percent in 2014 to 24.7 percent of GDP between 2014 and 2021. Add in the spending from fiscal space (2.8 percent) and the fall is still substantial.

As I stated before – it’s not all about increasing spending. We need to spend more efficiently with greater accountability and transparency. But even if we were to be the most efficient spenders in the EU, we would still end up being one of the lowest.

So we have a choice.

The only other country that comes close to us is the Tory-led UK. Do we want to follow a Tory model of low-spend or a continental model?

If we want the former, don’t be surprised to see loss of competitiveness, poverty, inequality and poor public services dominate the headlines over the next few years.

But if we want the latter – a continental model – then we not only have to reject proposals for tax cuts, we need to begin a debate over which taxes we are going to raise.

And we better start that debate now, before we find ourselves stuck in the Ultra-Low Spend Zone.

Michael Taft is Research Officer with Unite the Union. His column appears here every Tuesday. He is author of the political economy blog, Unite’s Notes on the Front. Follow Michael on Twitter: @notesonthefront
90299569Michael-Taft

From top: Joan Burton and Enda Kenny at a JobBridge announcement in 2013: Michael Taft

JobBridge, the poorly-conceived, figure-massaging internship scheme, is finished.

But what – if anything – should replace it.

Michael Taft writes:

The Sunday Business Post’s investigation into JobBridge was devastating.

JobBridge has been used to staff the HSE, Hewlett-Packard, public enterprises, supermarkets and universities.

A large number of interns report frustrations, especially as they have almost no workplace rights, while the investigation showed a scheme that grew out of control lacking robust monitoring and compliance mechanisms.

It’s time JobBridge was closed down.

The youth section of Unite the Union has long campaigned for its abolition; Impact has recently called for the programme to go. It’s already being reduced.

The programme will be cut from €70 million last year to €51 million this year. Cut the rest of it. And let’s use the money to create a real programme of work, targeted at people who are having a hard time in the market.

Long-term unemployment can be a dismal experience. The longer you are out of work, the more difficult it can be to get back in: your current skills may be become degraded, previous work routines are undermine, there can be mental health issues, you get stuck so far into a rut that it is difficult to pull yourself out.

Training programmes work best when the person is motivated and there is a belief that a job is possible at the other end. Long-term unemployment is the ultimate de-motivating experience, leaving people with little hope.

In 2015, long-term unemployment (without a job for more than a year) averaged 114,000. That amounts to 5.3 percent of the labour force. By contrast, long-term unemployment in the EU-15 makes up 4.7 percent.

When we turn to what can be called ‘chronic’ long-term unemployment – two years and longer – we find, on average, 83,000 stuck in this situation and, of this, 50,000 have been unemployed for four years or longer.

So let’s redirect the resources – approximately €85 million – from the JobBridge and Gateway programme) into a guaranteed real job programme.

In other words, the state should become an employer of last resort; when people cannot find work in the labour market, the state will provide that work.

What would such a programme look like?

An Employer of Last Resort

The Gateway programme is a local authority labour activation scheme that provides short-term and part-time work and training opportunities for people unemployed longer than two years.

Participants work for the local authority for 19 ½ hours a week and the placement lasts 22 months.The minimum weekly payment for participants is €208: Jobseekers’ payment plus a €20 top-up.

Participants can take up other part-time employment provided it does not interfere with their Gateway work placement.

There are two major problems with Gateway. First is the coercive element: those who refuse a placement without good cause may have their social protection payment reduced or even removed altogether.

Secondly, job displacement: there is a real danger that long-term unemployed are doing work that should be done by full-time local authority workers.

Let’s transform this programme (its advantage is that it doesn’t interfere in the business market):

* Turn the placement into full-time employment on the National Minimum Wage with contracts for two years (there could be some provision for part-time work where appropriate).

* Extend the programme to all non-profit and civil society groups in addition to local authorities.

* Remove the coercive element and make the programme voluntary.

* Target, in the first instance, people out of work for two years or longer with particular (though not exclusive) emphasis on young people, those over 50 years and high unemployment areas.

* Integrate work with training/education. This is important as many of those on long-term unemployment may have skills deficit which would limit their transition from the scheme into other work.

To the extent that local authorities expand their job opportunities, this should only be undertaken where there is a prospect of transition to a full-time local authority job, overseen by employers and trade unions.

What Kind of Work?

There will be criticism that such programmes are largely ‘make-work’. However, when looking at the employment currently offered by local authorities through Gateway, we can see that there is real work going on:

GIS mapping * HR – to assist in running with Gateway projects * CMAS communications * digitising records, town and country files * ergonomic assessments * sustainable energy projects * Using CRM for health and safety tracking * LCDC administration * marketing and promotional work for local enterprise (buy / source local campaigns) * records management and data entry * social media (website, Facebook, Twitter) * library supports * Basic horticultural work i.e. planting, weeding in parks, walking trails, derelict sites * Amenity improvement schemes – bench-making, carpentry * Biomass Scheme – plant, maintain and harvest areas of willow biomass * graveyard maintenance * Sports development (e.g. walking, basketball and soccer clubs) * local museum supports (research, reception, security, exhibit guide) * historical sites * arts programmes for key groups (e.g. arts and disability) * tourism supports

This is some of the work that is already being undertaken –providing a broad range of opportunities up and down the skill ladder.

Community Participation

Under the current Gateway programme only local authorities can provide placements. This should be extended to non-profit groups, civil society organisations and community groups – allowing them to devise programmes that would employ people.

The range of such groups could be considerable:

Geographical-based community groups * single-issue groups (unemployed, arts, drug rehab groups, disability support groups) * local Chambers of Commerce and Trade Union Councils branches * environmental groups * Development and Area Partnerships * retirement and elderly groups * Youth Clubs * parish councils and church groups * rural support organisations * citizen information centres * literacy groups

The criteria for participation should be that civil society groups are non-profit, do not compete with commercial enterprises and create programmes with projected outcomes that are measureable.

One can imagine these groups coming together – under the organisation of the local authority – in small town, city suburb, rural area, villages to create programmes that would add to the community wealth and the local economy.

This is about community regeneration and repair, participation and democracy.

Funding the Programme

I estimate that the combined JobBridge / Gateway budgets could employ nearly 7,000 on a full-time basis (with a €3,700 payment for resources, materials and training). This is based on the wage minus the Jobseekers’ Allowance paid.

However, this doesn’t count the tax and PRSI gain the government would gain –which, on average, would be approximately €2,400 including employers’ PRSI. Nor does it count extra consumption tax revenue from greater purchasing power recipients would receive.

We could take a more radical approach and examine the prospect of amalgamating a number of schemes besides JobBridge and Gateway: Tus, Community Employment Programme and the Rural Social Scheme.

There is a total of €627 million spent on all these schemes combined. Are we getting the best impact out of this – in terms of employment and social value?

We should be aware that some of these schemes cater for more than just long-term unemployed.

The Rural Social Scheme, for instance is targeted at under-employed and low-income people working in agriculture and fishing.

Nonetheless, an amalgamated programme catering for full-time and part-time work, aimed at different social constituencies could be considered.

This employer of last resort programme will not create a full employment economy. That can only come about when all the levers available to the Government – labour market, fiscal, investment, enterprise policy – are pulling in the right direction.

This is only a modest start – but one that can be expanded if it is seen to work.

This is a programme to get people back into work, back into the social networks that will help them to explore new life-chance and job opportunities for themselves. It is about giving hope.

And the great thing is that this is wholly feasible and can be paid out of current resources. One thing’s for sure – it would be a great investment.

Michael Taft is Research Officer with Unite the Union. His column appears here every Tuesday. He is author of the political economy blog, Unite’s Notes on the Front. Follow Michael on Twitter: @notesonthefront
Rollingnews

Yesterday: HSE Decided At A National Level To Use JobBridge

90415419Michael-Taft

Tesco, Clearwater, Finglas, Dublin 11; Michael Taft

Many of the women and men who serve you in a shop, supermarket or department store are living in poverty and deprivation.

Michael Taft writes:

Workers at Tesco Ireland  have voted overwhelmingly for industrial action to resist the proposed wage cuts that management is demanding. The issue is now going to the Workplace Relation Commission. This post is not about the details of the Tesco dispute (you can read about it here).

However, it is timely to take a step back and look at wages that not only Tesco but all retail workers earn.

And when you sneak that peak you will find that retail workers in Ireland are some of the poorest paid in the EU-15.

grph

According to Eurostat (the baseline figures are from 2012, brought up to 2014 with the Labour Cost Index), Irish retail workers rank 12th in the EU-15. And these wages are well behind European averages.

Irish retail workers would need a 20 percent increase to reach the EU-15 average.

But when we compare Ireland with our peer group, the comparison deteriorates dramatically.

One peer group are Northern and Central European economies (NCEE). This is the EU-15 figure excluding the poorer Mediterranean countries (though it’s worth noting that Italian retail workers earn more than Irish). In this comparison:

Irish retail workers would need a 35 percent increase in the hourly average wage.

A second peer group is other Small Open Economies (other SOE). This is a comparison used by the IMF and it refers to economies with small domestic markets and a high reliance on exports, just like Ireland.

This category includes Austria, Belgium, Denmark, Finland and Sweden. In this comparison:

Irish retail workers would need a 54 percent increase in the hourly average wage.

Some may object to this, claiming that if a company is not profitable, it cannot increase wages.

This is true enough. But we are confronted with a problem: the last year we have comparative enterprise data in the retail sector is 2012 – a bottom point in the retail business cycle with the economy still mired in a domestic demand sector.

Although profits per employed was about 15 percent below the EU-15, profits in the foreign-owned sector (such as Tesco) was the highest in the EU-15. So even with the consumer economy at rock bottom, a substantial part of the retail sector was doing OK.

Of course, this information should be open and transparent – not only for the workers but for society as a whole. Currently, a high number of firms, especially in the retail sector, are not legally required to make public their full financial accounts.

These firms can be branch affiliates of foreign-owned firms (e.g. Tesco, Aldi, Lidl, etc.), private unlimited firms (Dunnes Store is a major example) and a range of firms whose turnover is below a threshold (yet they can employ a significant number of people). The new government should examine these inequitable and secretive provisions.

Nonetheless, recent trends are looking decidedly better. In the last year, Irish retail turnover increased by nearly three percent; in the EU-15 the growth rate was half that. And with a gross operating rate (profits as a percentage of profits) at the EU-15 average, the Irish retail sector is moving back to, if not already exceeding, European averages.

What can be done to drive up employees’ wages?

From the Government end, it could strengthen workers’ rights – the right to collective bargaining, the right of part-time workers to extra hours when they become available (this is already an EU Directive, just not one that operates here), legislate for Sunday premium and overtime, etc. All these would help promote wages.

From the workers perspective, the best thing is to join a union. Mandate – the retail union – recently published a survey which showed that workers in trade unions fare much better than workers outside unions. From the survey:

Retail workers in unionised employments earn an average of €13.03 per hour compared to €10.04 for non-union workers.

100 percent of unionised retail workers have pay scales with service increments, compared to only 14 percent in the non-union retail sector.

The average minimum hour contract for retail workers in unionised employments is 24, compared to 16 hours in non-union employments; a difference of approximately €100 per week.

16 percent of workers in the non-union sector say they work under zero hour contracts, whereas there is no evidence of zero hour contracts in the unionised retail sector.

Those are pretty powerful reasons to join a union.

Ultimately, the struggle over workers’ living standards is a combination of political action and workplace organisation. The retail sector is no different.

And there is a great need for that combined effort. Micheal Collins from the Nevin Economic Research Institute found that 42 percent of workers in the Wholesale and Retail sector were paid below the Living Wage level.

Many of the women and men who serve you in a shop, supermarket or department store are living in poverty and deprivation.

That is economically inefficient, socially obscene and ultimately resolvable at a political and industrial level.

Victory to the retail workers – to the Tesco workers, to all workers who serve us every day: economic and social prosperity depends on it.

Michael Taft is Research Officer with Unite the Union. His column appears here every Tuesday. He is author of the political economy blog, Unite’s Notes on the Front. Follow Michael on Twitter: @notesonthefront

Note: Data for wage chart can be found here and here. To get specific data on profits is to run through a maze but a short-hand can be found here with provision to adjust for working hours here.

Rollingnews

90414540

Michael-Taft

From top Micheál Martin and Enda Kenny; Michael Taft

The author presents five experiments for a new government  to promote people’s life-chances and conditions, greater participation in the economy and enterprises, and authentic grass-roots democracy.

Michael Taft writes:

We will soon have a government. What kind will it be? Time and a Programme for Government will tell. But what we really need is an experimenting government; one that uses its resources and creativity to experiment with different proposals.

There are many good ideas out there but it is hard to know how they might impact on the economy and society were they introduced in one go.

Commissions, green papers and studies can only tell you so much. We should experiment – trialling ideas for a limited period in different contexts and sectors. We can then assess the results to see if they are runners. Here are a few examples.

1. Shorter Working Week

I wrote about this here. In Sweden a number of trials are being conducted to assess the impact of a shorter working week in terms of cost, productivity, firm or agency performance, customer satisfaction and the health and well-being of the employees.

Why not trial it here? We could select public and private sector workplaces to run 18-24 month experiments in reducing the working day. A study of productivity and all other elements would be done before and after the trial period and the results made public for study and debate.

2. Basic Income

Basic Income – a guaranteed payment to everyone regardless of employment status – is attracting more attention and discussion. Arguments centre around a new era of reduced formal work opportunities, the growing complexity of welfare states, strengthening workers’ bargaining power (if I have a living income to fall back on, I can walk away from the boss’s grief), etc.

But there are downsides: the high cost of implementation, inflation, unknown impact on the labour market. This is complicated by right-wing arguments that with Basic Income we can abolish the welfare state and minimum wages.

It is unlikely that a Government would introduce Basic Income all at once, or across the board. If it didn’t work out it would be very expensive to undo the policies and repair the damage. However, some places are conducting experiments – for instance, Utrecht and other Dutch cities. It will be limited to a certain cohort but the hope is to discover how it changes people’s behaviour and what the fiscal and bureaucratic impact would be.

So why don’t we do the same thing – we could model it on the Dutch experiments so we don’t have to re-invent the wheel. It could be run out in urban and rural areas for a time-limited period with the effects to be studied afterwards.

3. Labour-Managed Enterprises

There has been increased academic interest in the performance of labour-managed enterprises (workers’ cooperatives, employee-ownership and other models). While extremely limited in Ireland, there are a considerable number operating in other countries – notably France, Spain and Italy – throughout the industrial and service sectors.

Proponents argue that such enterprises increase productivity and firm performance while generating higher investment and reduced wage inequality.

Here is an opportunity to run a trial programme – through Enterprise Ireland, local enterprise boards or a new agency if that is seen a better fit. It would provide funding and training, and work with firms that are closing down due to poor performance or owner-retirement as well as greenfield start-ups.

This experiment would take time – a firm may survive the first and even second year but could fold soon afterwards. However, this could be an on-going process, with periodic reports and analysis.

This shouldn’t be too contentious – after all, it is about generating indigenous enterprises and putting people back to work. What we might find is that labour-managed firms are a better route to those goals, with positive spill-over effects in the community.

4. Employee-Driven Innovation

You want to reform public services? Improve their quality and cost-benefit? You start with those who are knowledgeable about how the service is run – the defects, the shortcomings as well as ‘what works’. You start with the employee.

Employee-driven innovation acknowledges that one of the best ways to improve the quality and efficiency of a service is to involve employees in the management of that service. In other words, employees become the ‘innovators’, the ‘reformers’.

Here I write about two examples of employee-driven innovation – in the Danish Railways and Stockholm Water. While there are different models the basic idea is that you bring together workers in small teams through a formal structure, within a sector or an individual workplace, across grades and occupations.

These teams go through the shortcomings of the services and make proposals to improve them. This process must have buy-in from both workers and managers which requires a considerable level of trust. The proposals are then put to a joint committee of management and workers to assess and implement.

We could roll this process out on a trial basis in a limited number of areas – in the public sector and public enterprise companies. We may find that going to those who actually produce the goods and services could be a valuable reform resource.

5. Participatory Budgeting

Ever since Porto Allegre in Brazil first introduced ‘participatory budgeting’, their model has been adopted and adapted in over 1,500 cities worldwide. Participatory budgeting allows people to decide how to allocate part of a municipal or public budget. It gives people the right to identify, discuss, and prioritize public spending projects, and gives them the power to make real decisions about how money is spent.

It can be a protracted process, with community meetings throughout the local authority area to discuss priorities and goals, elect community delegates who then work with the officials to implement the most popular proposals.

When it is done well (rather than just as a PR consultation process without power), it can build greater community and political participation, and result in better outcomes.

Cities in other countries are trying it so why don’t we? Select a few places (again, urban and rural, large and small), agree a process with community groups, and trial run it using the most appropriate model found in other comparable locations.

******

Five experiments – shorter working week, Basic Income, labour-managed enterprises, employee-driven innovation and participatory budgeting; you are probably getting the idea.

These are experiments to promote people’s life-chances and conditions, greater participation in the economy and enterprises, and authentic grass-roots democracy.

And the great thing about this is that the cost would be minimal and once-off. This would be an investment in ideas and people. And it would start to popularise these and other ideas about how we can reshape our economy and society to make it a more prosperous and efficient place for everyone.

So whatever government we get in the next few weeks, please let it be an experimenting government. One that is not afraid to test out new ideas.

Michael Taft is Research Officer with Unite the Union. His column appears here every Tuesday. He is author of the political economy blog, Unite’s Notes on the Front. Follow Michael on Twitter: @notesonthefront

90353981Michael-Taft

From top: College Green, Dublin 2;  Michael Taft

What is the real story with Irish wages?

Michael Taft writes:

With all the talk about industrial action and wage claims and wage offers and summer of discontent, etc. etc. etc. it is worth taking a step back and to look at the big picture.

Are Irish workers paid too much in comparison with other EU-15 countries?

A blog written by the Director of the Nevin Economic Research Institute, Dr. Tom Healy, looks at the adjusted wage share in the economy. That’s one way of measuring wages – and it shows Ireland performing pretty badly in comparison.

Here I am going to approach this issue by quantifying the proportion of the economy that goes on wages. But whenever you go down this route you are faced with a big question.

Do we use GDP which is inflated by multi-national profits which are not generated here but are imported to take advantage of our corporate tax regime?

Do we use GNP even though this is also inadequate as it excludes actual productive activity? Or do we use the Irish Fiscal Advisory Council’s hybrid-GDP which attempts to measure our actual economic or fiscal capacity?

Let’s take a cautious, conservative approach and use GNP. In terms of EU comparisons this means using Gross National Income (GNI) which is essentially GNP including payments from the EU (CAP funding, etc.).

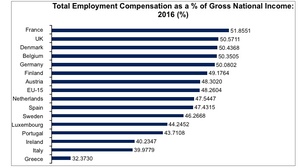
When we do this we find Irish workers, collectively, are paid a small percentage relative to workers in other EU countries.

1

The EU Commission’s AMECO database estimates for 2016 finds that Irish employee compensation is near the bottom of the EU-15 table.

Employee compensation combines both wages and employer social insurance contributions; this is the standard measurement of wages and, as such, can be taken as a very close proxy to ‘labour costs’.

Throughout the EU-15, wages make up 48 percent of GNI. In Ireland compensation makes up only 40 percent – equal to Italy and ahead of lowly Greece (if we used GDP or the Fiscal Council’s hybrid-GDP, the percentage would be even lower).

What would happen if Irish wages rose to the average EU-15 level?

Total wages would rise by €15.4 billion, or 20 percent more than today.

That is the equivalent of €9,400 per Irish employee.

Of course, economies and wages are never so simple; therefore, you can’t run a slide-rule over gross numbers and extrapolate an optimal wage figure.

Much depends on the bargaining power of workers vis-à-vis employers, the position in the business cycle, the sectoral structure of the economy (high-tech? medium-tech?), compositional effect, productivity levels, etc.

However, we can’t get away from the fact that Irish wages take up far less of Gross National Income than in almost all other EU-15 countries.

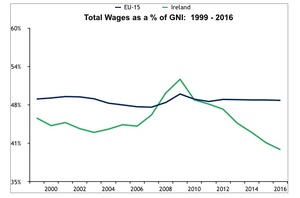
This is not a recent phenomenon.

2

Prior to the crash Irish wages remained well below the EU-15 average. The spike in at the beginning of the crisis doesn’t mean that Irish wages rose. In 2009, they fell by 9 percent and, again in 2010 by 7 percent. The reason wages increase in the graph is because GNI fell even faster – by 13 percent in 2009.

However, by 2011 normal business was restored and since then Irish wages have fallen by 8 percentage points.

One may dispute the legitimacy of a particular wage claim or wage offer. But when you step back and look at the broad landscape – just as Dr. Healy did – one can’t avoid the conclusion that Irish workers are not well paid in comparison with other European workers; at least not in terms of the proportion of the wealth that they generate.

Michael Taft is Research Officer with Unite the Union. His column appears here every Tuesday. He is author of the political economy blog, Unite’s Notes on the Front. Follow Michael on Twitter: @notesonthefront