Tag Archives: Michael Taft


lead_large

Michael Taft

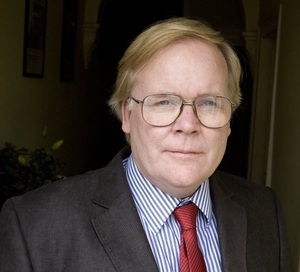
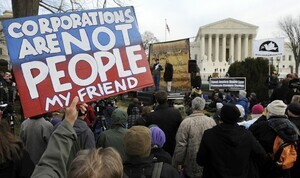
From top: Corporate ownership protest, Washington DC; Michael Taft

There has been a decades-long debate over who actually ‘owns’ the corporation, in the sense of who actually ‘controls’ it.

We may have an answer.

Michael Taft writes:

To ask ‘who owns the corporation’ is to invite a simple reply: the shareholders. After all, don’t shareholders vote at AGMs, doesn’t the law state that shareholders own the company. Doesn’t the company have to act in the interest of the shareholder?

Seems straight-forward. But it’s not. In fact, it has been argued that no one owns the corporation. If this is the case the implications could be significant.

The Financial Times’ Peter Kay argues the ‘no-one-owns-the-corporation’ line:

‘If I own an object I can use it, or not use it, sell it, rent it, give it to others, throw it away and appeal to the police if a thief misappropriates it . . . But shares give their holders no right of possession and no right of use.

If shareholders go to the company premises, they will more likely than not be turned away. They have no more right than other customers to the services of the business they “own”. The company’s actions are not their responsibility, and corporate assets cannot be used to satisfy their debts.

Shareholders do not have the right to manage the company in which they hold an interest, and even their right to appoint the people who do is largely theoretical.

They are entitled only to such part of the income as the directors declare as dividends, and have no right to the proceeds of the sale of corporate assets — except in the event of the liquidation of the entire company, in which case they will get what is left; not much, as a rule.’

So who owns the company?

The answer is that no one does, any more than anyone owns the River Thames, the National Gallery, the streets of London, or the air we breathe.

There are many different kinds of claims, contracts and obligations in modern economies, and only occasionally are these well described by the term ownership.’

There has been a decades-long debate over who actually ‘owns’ the corporation, in the sense of who actually ‘controls’ it: managers or shareholders or a combination of both.

We can get a better handle on this if we recognise that the corporation is a legal fiction – a ‘legal person’ that enables the corporation to operate in the world (buy, sell, own, sue, go into debt, break the law, etc.). As such, this legal person is not ‘owned’ in the popular sense of the word.

Tom Powdrill quotes a Contexte summary of the revisions to the EU shareholders’ rights directives:

‘Shareholders do not own corporations: The directive will explicitly acknowledge that shareholders do not own corporations – a first in EU law.

Contrary to the popular understanding, public companies have legal personhood and are not owned by their investors.

The position of shareholders is similar to that of bondholders, creditors and employees, all of whom have contractual relationships with companies, but do not own them. ‘

Even if one insists on the ‘ownership’ paradigm, one has to admit that the character of ownership has changed – from individuals to institutions with ownership being measured in weeks (an average of 35 weeks as opposed to 1970 when the average share holding lasted seven years); and sometimes in seconds due to high-frequency trading.

In this sense we can understand a corporation as a ‘space’, a dense series of contractual relationships that includes management, shareholders, bondholders and creditors, employees, etc.; in other words, the totality of relationships with all the stakeholders.

This list can be extended to communities, the environment, nation-states, supra-national organisations (e.g. the EU), etc.

And how are these contractual relationships determined? In the apparent instance, they are politically-determined (legislation that gives certain rights to different stakeholders). Ultimately, they are determined by the power-relationships between these different stakeholders.

So what? It’s still the same ol’ corporation that we have known and loved since the introduction of limited liability. I would say there are at least two reasons why this matters. First, is the concentration of ownership, control and power.

The New Scientist published a comprehensive survey of global multi-national corporations. In the first instance they found a core of 1,381 companies which collectively controlled the majority of world’s large blue chip and manufacturing firms (what’s called the ‘real economy’ – that is, the non-financial economy).

However, when they dug further they found what they called a ‘super-entity’ of 147 inter-locking companies controlled 40 percent of multi-national companies world-wide. Most of these 147 super-companies were financial institutions.

Second, the relationships within and between multi-nationals are more and more determined politically.

France’s decision to give more voting weight to shareholders who hold on to their shares longer (in the hope of incentivising long-term commitment); the OECD’s and the EU’s moves on tax transparency; the role of stakeholders in corporate governance legislation – all these can be interpreted as moves to make the corporation more accountable both to society and the productive economy. All these are political decisions.

Ultimately, though, this all suggests a new, potentially more democratic perspective.

If the corporation is not so much owned but exists through a series of contractual relationships between stakeholders and participants, then we can see the totality of the corporation as a ‘social’ or ‘collective’ asset that operates within a complex market of economic calculation and the international division of labour.

Once we break with the concept of ‘ownership’ (though we will always use this in a popular sense) and understand it as one of ‘control’ – this begs the question: who controls the controllers?

This is a both a political and economic issue; it is a systemic one. It is about power-relationships both within the corporation (the balance between capital and labour being a primary one) and the relation of the corporation with the rest of society, including the environment.

So if no one owns the corporation then can we all own the corporation? It is a democratic issue; neither simple nor unsolvable.

Michael Taft is Research Officer with Unite the Union. His column appears here every Tuesday. He is author of the political economy blog, Unite’s Notes on the Front. Follow Michael on Twitter: @notesonthefront

90424333Michael Taft

From top: Ministers Richard Bruton, Leo Varadkar, Charlie Flanagan and Simon Harris  at the annual National Day of Commemoration Ceremony; Michael Taft

Minister for Social protection Leo Varadkar’s hope to increase unemployment benefits and reduce uncertainty for people losing their jobs  is a small step in the right direction.

Michael Taft writers:

The Minister for Social Protection, Leo Varadkar, has been floating some ideas. The latest one concerns increased unemployment benefits – along the lines of basic European practice (sort of).

His idea is that workers who become unemployed would receive €215 per week for the first three months; €200 for the second three months; after that, they would receive the current basic rate of €188 per week.

Though this is quite modest it is certainly heading in the right direction. This is about the economics of social security and what is called in the literature ‘uncertainty avoidance’. For people losing their jobs, they are liable to a sudden drop in their income which puts pressure on their living standards.

The economy suffers because of their reduced purchasing power. And this skewers the labour market as many people grab the first job they can regardless of the skill match – thus leading to less than optimal results.

Other European countries get over these problems by providing pay-related unemployment benefit. In its simplest terms, a worker receives a percentage of their previous wage for a set period of time – before falling back to a basic, usually means-tests, payment. This protects living standards, maintains demand, and facilitates optimal job-hunting.

The pay-related benefit can be quite substantial.

graph

Ireland is not the lowest (the UK is, but Council Tax Benefit makes up on average more than twice the level of unemployment benefit) but it is well behind all other EU countries in our peer group. The Minister’s proposal would close some of the gap.

However, there is one big difference with the continental model. The Minister’s proposal is still a flat-rate. In other EU countries, the payment is linked to the previous wage; the higher the wage, the higher benefit. For instance, in Austria, the weekly benefit of €259 is for someone previously on €36,000 (the Irish average wage).

However, for an Austrian previously on €50,000 pay, unemployment benefit would rise to €335. This Minister’s proposal wouldn’t do that.

Also, the length of the payment is minimal compared to other countries where the pay-related benefit can last a year or longer.

The Minister has claimed his proposal would cost approximately €35 million. That is fairly minor cost. We should aim for a fully-blown pay-related payment with a high replacement ratio (unemployment benefit as a percentage of the previous gross wage) that lasts a year. There would be a threshold above which the payment would be frozen. And the payment would last a year.

Take the example of an employee who loses their job. She was earning €30,000. She will now receive 50 percent of her previous wage – €15,000. She will receive this for a year. If she is still unemployed after a year, her benefit will run out and she will switch to Jobseekers’ Allowance (a means-tested payment).

It is difficult to estimate the cost as we don’t have data on duration and previous income. In any event it would be phased in over three years or so.

But a back-of-the-envelope job – based on trebling the increase in the Minister’s proposals and doubling the length of time – would suggest a cost of €200 million (though it could be less depending on the income range of new entrants on to benefit and how long they stay on benefit).

This could be paid for – as it is on the continent – by an enhanced employers’ social insurance (Irish employers’ social insurance is one of the lowest in the EU; it would have to more than double to reach the European average). A fractional 0.25 percent increase would pay for the enhanced benefit – hardly onerous.

But there is benefit for business as well – the increased benefit would result in higher consumer spending. And the Government would benefit from the increased tax revenue – both income tax (unemployment benefit is taxable) and indirect taxes.

And for people the benefit is obvious: when they suffer the loss of employment, at least their income will be maintained for a period while they get back on their feet.

Let’s hope the Minister continues floating these kinds of ideas. Here’s a few more he may wish to let glide:

Pay-related sickness benefit

Pay-related maternity and paternity benefit

Pay-related validity pension and occupational injuries benefit

And, ultimately, a pay-related old age pension

We may yet join the rest of Europe in providing a modern social protection system.

Michael Taft is Research Officer with Unite the Union. His column appears here every Tuesday. He is author of the political economy blog, Unite’s Notes on the Front. Follow Michael on Twitter: @notesonthefront

Rollingnews

115859192_Cyclist_352377c

Michael Taft

From top: Cycling in Copenhagen, Denmark, Michaerl Taft

There’s something rotten here.

Only the poorer Mediterranean countries spend less on public services.

Michael Taft writes:

One of the impacts of the CSO’s recent National Accounts data – the one that shows the economy growing by 26 percent – is that all our main economic measurements are practically useless.

It’s not that we didn’t have trouble before last week.

Using GDP was always fraught, given multi-national accounting practices. But at least we could fall back on GNP or GNI or the Irish Fiscal Council’s hybrid-GDP measurements. Now these are shot as well. We are in a fog.

The former Governor of the Central Bank, Patrick Honohan, was spot on:

‘The statistical distortions created by the impact on the Irish National Accounts of the global assets and activities of a handful of large multinational corporations have now become so large as to make a mockery of conventional uses of Irish GDP . . . GNP is now almost as unhelpful an aggregate economic measure for Ireland as GDP . . . Ratios to GDP are now almost meaningless for Ireland in most contexts. They need to be supplemented by alternative purpose-constructed ratios for specific uses . . .’

So now the hunt is on for robust ‘purpose-constructed ratios for specific uses.’ This will entail a new debate, a flurry of number-mongering and endless disagreements.

Take, for example, our expenditure on public services. Using CSO figures spending on public services fell from 13.7 percent of GDP in 2014 to 10.5 percent last year, even though spending on public services rose.

And comparing ourselves to other European countries is equally meaningless. GDP per capita in the EU-15 was €33,000 in 2015. According to the Government projections, Irish GDP per capita was supposed to be €46,000 – already inflated by multi-national activity.

After the CSO release, GDP per capita has shot up to €55,000. That’s 67 percent above the EU-15 average. Unreal.

So how does our spending on public services compare with other European countries? Here’s one suggestion for an ‘alternative purpose-constructed ratios’: spending on public services per capita.

Of course, nothing ever being simple, we have to choose between nominal spending (actual Euros and cents) and real spending (factoring in actual purchasing power).

I’ll go with the latter – this counts what countries actually get for their spending excluding inflation and living costs.
graph

This shows Ireland a low spender. Only the poorer Mediterranean countries spend less on public services. We fall 10 percent below the EU-15 average.

However, it doesn’t tell us much that we spend more per capita than, say, Greece or Portugal – two relatively poor countries in this table.

So when we compare ourselves to our peer group, Northern and Central European economies (NCEE: excludes the Mediterranean countries), we fall 18 percent behind.

And when we compare ourselves to another peer group, other small open economics (SOE: Austria, Belgium, Denmark, Finland and Sweden), we fall 25 percent behind.

But there are a couple of things we should bear in mind:

First, given that we don’t have as high a proportion of elderly, we wouldn’t have to spend as much on health and other elderly-related services. However, we have a much proportion of young people; therefore we have to spend more on education and other services.To what extent these spending ratios cancel each other out would require more research.

Second, Irish spending on public services is subject to very low purchasing power (like consumer spending). We have to spend €113 to match the EU-15’s average €100 just to purchase the same goods and services.

This inflation, though, is not confined to Ireland. Denmark, Sweden and the UK have weaker purchasing power than us.

Another issue is that of reform. The previous government claimed to reform public services but this was mostly made up of cutting employment, increasing hours and cutting wages.

‘Doing more with less’ only means we have less.

A real reform process would include the producers and users – the public sector workers and the users of the public services. It would further distinguish between process issues (are we doing things in the most efficient way) and structural issues.

For instance, does the role of the private sector in our public health system drive up costs? Does it produce perverse incentives that increase costs per patient?

The bottom-line, however, is that we are an under-spender on public services.

To reach the EU-15 average, we’d have to spend an additional €3.6 billion

To reach the average of Northern and Central European economies, we’d have to spend an additional €7.3 billion

To reach the average of other small open economies, we’d have to spend an additional €11.2 billion
These are big sums. Even after tackling inflation and reform issues, we will still be faced with big sums.With the aid of purpose-constructed ratios for specific uses we now see the challenge we are facing.

How will the ‘new politics’ measure up?

Michael Taft is Research Officer with Unite the Union. His column appears here every Tuesday. He is author of the political economy blog, Unite’s Notes on the Front. Follow Michael on Twitter: @notesonthefront

90387492Michael Taft

From top: Taoiseach Enda Kenny at the Low Pay Commission report on the minimum wage last year; Michael Taft

The relationship between wages and competitiveness is not a crude reductionist equation.

We pay a real cost for our low wage levels.

Michael Taft writes:

There is a narrative among the Left that claims that capital has not wasted the recessionary opportunity, that capital has exploited the crisis to depress wages in order to boost profits.

We should, of course, be sceptical about such sweeping narratives. We live in a complicated, complex world where exceptions and caveats invariably rule.

So let’s test this claim and see if it holds – at least in Ireland; at least on the issue of wages.

There are many ways to measure wages (Dr. Tom Healy of the Nevin Economic Research Institute looks at it this way). I will use employee compensation as a percentage of Gross National Income (GNI).

Employee Compensation: this is made up of the direct wage (what the employer pays the employee) and the ‘social’ wage (what the employer pays into a social insurance or similar fund – out of which employees access public services at below-market costs such as health, and in-work benefits such as sick-pay, maternity benefit, etc.).

Gross National Income: this is essentially GNP. This is not an optimal benchmark as it excludes a significant amount of wealth that is generated in the economy.

However, it does have the advantage of excluding both multi-national profits that are generated in other countries but end up here for tax avoidance purposes, along with profits that are actually generated here but then repatriated. Therefore, GNI is the bottom-line of bottom-lines.

So how do Irish workers fare?

1

We don’t fare well.

Up to the crash, when wages were rising, Ireland was still below the main European comparators – the EU-15, Northern and Central European economies (NCEE – this excludes the poorer Mediterranean countries), and other small open economies – (Other SOE, countries with a similar open, export-dependent structure: Austria, Belgium, Denmark, Finland and Sweden).

When the crash hit, the graph shows Irish wages spiking but one has to be careful. Between 2007 and 2009 wages rose – as a proportion of GNI (from 46 to 52 percent of GNI); yet, during this period total wages actually fell by 6 percent. In fact total wages fell a further 8 percent up to 2012.

The reason for the spike is not rising wages but falling national income.

But as we came out of the recession, wages didn’t recover their pre-crash levels. Between 2000 and 2007, Irish wage levels averaged 44.2 percent of GNI. In 2017, the EU estimates this will have fallen to 39.6 percent.

2

And it’s not like Ireland is a ‘poor’ country.

When we measure GNI per capita we find that Irish levels are 10 percent higher than the EU-15, marginally ahead of Northern and Central European economies and at that same level as other small open economies.

Unite the Union recently published its The Truth About Irish Wages. Using EU labour cost data it found that Irish wages are well below the European benchmarks.

But the real story is how low Irish wages in low-paid sectors are.

3

Irish compensation levels in these sectors are well below the average of other European countries – well below.

The Irish low-paid are ultra-low paid.

Some might argue that we need low wages so that our exports are/become/remain competitive. However, other small open economies have much higher wage levels than we do and it doesn’t seem to affect their export levels.

Further, in our main export sectors – chemicals/pharmaceuticals and the information & communication sector – our wages are at average European levels. These sectors haven’t been affected negatively.

The relationship between wages and competitiveness is not a crude reductionist equation.We pay a real cost for our low wage levels.

First, is the low level of tax revenues. Taxes on labour are higher than taxes on capital. Therefore, when the latter is privileged, tax revenues are not optimised.

Second, our business sector suffers from low levels of consumer income. This not only affects businesses that primarily sell into the domestic markets; it makes it difficult for domestic businesses to transition to export markets.

Moving into exports requires a considerable investment which higher sales revenue from domestic income can help finance.

Third, it affects workers’ living standards and especially those in sectors that are reliant on discretionary spend; less revenue coming into sectors like restaurants means less money that goes on pay.

So, yes, those lefties and their sweeping narrative appear to be on to something. Now we have to start debating how we write another narrative.

Growing wages to the European level – including both direct and social wages – is one of our main challenges. We need a strategy to make a fundamental shift from an economy reliant on low wages and low-paid sectors.

This goes beyond just increasing wages. It is about creating high-road employment and businesses that are focused on investment, R&D, re-skilling and innovation, rather than sweating labour.

The big question is: do we have the capitalists to do that?

And if we don’t, what do we do then?

Michael Taft is Research Officer with Unite the Union. His column appears here every Tuesday. He is author of the political economy blog, Unite’s Notes on the Front. Follow Michael on Twitter: @notesonthefront

788-waitress-1200
Michael Taft

From top: Waiting staff have seen no increase in wages; Michael Taft

Employese are thumbing their nose at the state’s collective bargaining machinery, amassing profits while depressing wages.

Michael Taft writes:

The Low Pay Commission (LPC) will soon be making its recommendation for the National Minimum Wage.

Last year, they recommended a 50 cents increase in the hourly wage – nine years after the last time it was increased (in early 2011 the minimum wage was cut by €1 but this only lasted a few weeks as the new government quickly reversed it).

What will the LPC recommend this year?

We’ll know soon enough. But hopefully they will take note of what is happening in low-paid sectors.

Because in the hospitality sector, for example, profits are going through the roof.

1

The hospitality sector, comprising accommodation and restaurants / food services, took a big hit in 2008, continuing to slide until 2010. However, since then profits have risen considerably. By 2014:

Total profits in the sector had risen to 36 percent above their pre-crash (2007) level. In 2007, total hospitality profits were €517 million; by 2014 they exceeded €700 million.

Profits per hour in the sector increased by over 43 percent. They rose from €2.50 per hour worked in 2007 to €3.60 in 2014.

Since the sector hit its trough in 2010, profits have increased by more than three-fold. What accounts for this?

First, the Government rolled out a stimulus programme (at least in one sector they heeded what progressives had been advocating for years): a reduction in VAT and a cut in the low-rate employers’ PRSI (the latter has been reversed).

Second, tourism expenditure increased by 50 percent between 2010 and 2014.
In this same period total household income increased by nearly 6 percent, potentially giving a disproportional boost to discretionary expenditure.

The National Accounts data only goes up to 2014. The CSO produces a Services Index which tracks real (i.e. after inflation) gross value added. This brings us up to 2016 1st quarter. Gross value added is equal to ‘sales minus costs’. Profits and wages are paid out of Gross Value Added.

What has been happening in the sector?

Between 2014 and the first quarter of this year, restaurants and food services has seen an increase of 19.2 percent in real gross value added.

In the same short period accommodation increased by 22.3 percent.

This is a strong indication that profits are continuing to grow at a brisk pace.

There have been a lot of good things happening in the hospitality sector – except for wages.

CSO data only goes back to the first quarter of 2008 but it shows that wages and weekly income have stagnated despite the recovery in profits and enterprise activity.

Between 2008 and 2016 the hourly wage has fallen marginally – from €12.51 to €12.48 per hour

In that same period average weekly earnings have fallen from €334 to €321, as weekly working hours have fallen.

Profits are over 40 percent above their pre-crash levels; wages have fallen. That tells a tale.

Here’s another story.

2

Eurostat data differs from the above CSO number in that they include employers’ PRSI and other labour costs, using a different methodology (though the Irish data would have been supplied by the CSO).

We find that employee compensation (or labour costs) in the Irish hospitality sector rank 12th out of the 14 EU countries.

Irish hospitality wages are 20 percent below the average of the EU-15 countries (Portugal not reporting).

They are 26 percent below one of our peer groups – Northern and Central European economies (which excludes the poorer Mediterranean countries).

And they are 36 percent below other small open economies (Austria, Belgium, Denmark, Finland and Sweden).

Compared to their fellow workers in other European countries, Irish workers in the hospitality sector are ultra-low paid.

And what are the employers’ response to all this? The Restaurant Association of Ireland has not only called for a freeze on minimum wage increases for five years; they are boycotting the Joint Labour Committee which was re-established by the last government in order to allow collective bargaining across the entire sector.

In a similar vein, the Irish Hotel Federation is also boycotting the Joint Labour Committee.

In effect, the employers’ are thumbing their nose at the state’s collective bargaining machinery, amassing profits while depressing wages. How’s that for responsible social actors?

Hopefully, the Low Pay Commission will take note of all this and respond accordingly. The chefs, floor staff, cleaners, clerical staff, bartenders – these are the men and women that make our hospitality sector work. The least, the very least they should get is a living wage.

Michael Taft is Research Officer with Unite the Union. His column appears here every Tuesday. He is author of the political economy blog, Unite’s Notes on the Front. Follow Michael on Twitter: @notesonthefront

coin
Michael Taft

From top: Euro coin; Michael Taft

A Europe that descends towards disintegration and far-right ascendency, mainstream paralysis and progressive atrophy will wash over our shores and no amount of corporate tax appeasement will prove an adequate flood defence.

Michael Taft writes:

Does the Brexit vote, with all its contradictions and incongruities, represent an anti-establishment vote?

The Brexit campaign was a struggle between two wings of the Tory party (including its breakaway, UKIP). Boris Johnston, Michael Gove and Nigel Farage on one side – representing small and nativist capital; David Cameron representing large and finance capital.

In essence, it was two establishments warring against each other as the chronically obstreperous alliance within the Tories broke down into a fight over ascendency and personalities. These two ‘establishments’ set the choice and the parameters of the debate.

Ultimately, the Johnston/UKIP wing was successful as it proved adept at exploiting many people’s intolerable economic circumstances and profound experience of powerlessness, projecting these on to the EU (not to mention outright appeals to an ultra-nationalism and anti-immigrant prejudice described  London Mayor Sadiq Khan as ‘Project Hate’).

This was a remarkable feat given that the Johnston/Gove/Farage troika were the chief cheerleaders of home-grown British austerity and the neo-liberalism that dominates EU policy.

The proportion of the Brexit vote that was a legitimate vote against austerity and powerlessness was effectively co-opted by right-wing elitist forces.

So, yes, the Brexit vote can be interpreted as two-fingers to the establishment. But only if it is remembered that those two fingers are attached to the hand of forces that Paul Mason rightly claims want to turn Britain into a ‘Thatcherite free-market wasteland’.

So how do we read this? As Thomas Fricke points out, the overwhelming majority of blue-collar workers supported the far-right Freedom Party in the recent Austria presidential campaign.

Does this constitute a vote for far-right values? Or it is a vote for the only outlet left to express opposition against alienation, loss of power, loss of identity – a vote which represents the powerlessness that working people experience throughout Europe and not just Britain.

In any event, what was the argument for Remain? To stay in an undemocratic and, at times, anti-democratic EU (witness the attack on elected Governments in Italy and Greece)? An EU which demands adherence to irrational fiscal rules that impoverishes huge swathes of Europe? An EU which has botched a common immigration policy?

An EU based on a flawed currency design overseen by a flawed central bank. Distant, centralised and bureaucratic – as one leading German insider put it – a bloodless technocracy: very difficult to mount an argument for that.

Cameron – and his wing of the Tory party – was even more compromised; having made a virtue for years of attacking the EU, detaching the UK at every opportunity; all in the name of maintaining ascendency over the nativist Troika, or at least an uneasy truce.

When this broke down, when battle commenced, arguing for Remain was a circle too big to be squared. Labour and progressives were reduced to either highlighting the dangers of Brexit (‘it’s bad now, but it could get worse’ – hardly a positive message), or producing abstractions such as ‘remain and reform’, without detailing what those reforms might be or if they were even possible. In truth, progressives were never going to win a battle that was being fought out between the two wings of the Tory establishment.

Ultimately, the anti-establishment vote merely ended up reinforcing an establishment which is seeking more ‘freedom’ from EU restraints, to exploit labour (Jeremy Corbyn’s ‘bonfire of workers rights’), to degrade social and environmental rights.

The Brexit victory risks giving even more oxygen to forces that are not just intent on undermining the EU; they are intent on returning to borders and currencies and narrow nationalist ideologies.

These forces are the greatest threat to European cohesion and cooperation. It was not the progressive parties who welcomed the Brexit result. It was Marine Le Pen. It was Geert Wilders. It was Donal Trump.

A friend of mine said she wished there was another vote she could cast – neither Remain nor Leave. This sums up the progressive dilemma which struggled to find some traction, some positioning in the referendum – struggled because there wasn’t a progressive option.

In the Irish Republic we are a little more fortunate as it is highly unlikely we will be faced with this choice. Support for the EU is very high. A recent poll showed 90 percent support for remaining in the EU and even after years of recession, austerity and bail-out economics, and 87 percent believe the EU has done more good than harm.

Nonetheless, we shouldn’t be sanguine. We are not an island afar off. A Europe that descends towards disintegration and far-right ascendency, mainstream paralysis and progressive atrophy will wash over our shores and no amount of corporate tax appeasement will prove an adequate flood defence.

The EU orthodoxy has no prescription. Its knee-jerk reaction to the Brexit result has been to call for greater integration. This ignores the swelling of disenchantment across Europe over the direction of the EU.

graph

While the UK (and Greece) may be at the more extreme end, there is a plurality in each of the countries polled for greater national powers.

This is not some narrow nationalist demand; it is a legitimate demand for more democracy, more popular participation and control in decision-making which, in current circumstances, can only be achieved at national level.

However, this is the conundrum: monetary unions, without fiscal and political union, do not survive for very long. A central bank needs a central government. If the Euro is to survive, greater integration is needed.

Yet greater integration is becoming more and more politically problematic. How can this circle be squared? Can it? What are the options? Or do we get mired in a ‘business-as-usual’ mode, clasping a copy of the Five President’s report, oblivious to everything outside the bubble?

Only the European Left is capable of confronting this issue.

Despite the complicity of many progressive sections with austerity and the neo-liberalism of the EU, its ideological roots put it in opposition – or at least in contra-distinction – to current economic and social policies which result from the current institutional configuration.

Only the Left is capable of taking on the nationalism of the Far Right and the centrifugal forces that would return us to borders, through the promotion of an ever deepening democracy.

However, the European Left has to be honest itself.

It is divided, politically exposed, and intellectually inert. If there is a way out of this, it will have to do two things: first, end the division – between social democracy, the communist and allied tradition, progressive greens and the popular anti-austerity movements. Progressive unity is vital.

And this should lead to the second task – to engage in a revitalised discourse together, connecting with the working class and progressive constituencies, to re-imagine Europe and our relationship with each other; all pointing to new European re-foundation.

In this way we can move beyond a leave/remain divide determined by conservative elites and towards a more authentic divide: between more or less democracy.

It’s either that or expect the Brexit vote to be the first step down a road that will have an unhappy destination for all Europeans.

Michael Taft is Research Officer with Unite the Union. His column appears here every Tuesday. He is author of the political economy blog, Unite’s Notes on the Front. Follow Michael on Twitter: @notesonthefront

90422285

Michael Taft

From top: Paul Murphy TD leads Protests outside South Dublin City Council offices yesterday; Michael Taft

What we need is an alternative to the current system of waste management.

Michael Taft writes:

The bin charges debacle is spiralling into chaos.

We have areas where two or three or four bin companies operate and other areas where companies are threatening to leave; escalating charges becoming an intolerable burden on many low-income households; considerable price variations between counties; off-shored private companies pursuing wage suppression to increase profits; considerable illegal dumping; charges for recycling which disincentivises a social good; and on and on.

This is not a waste management policy; it is a circus.

The Minister is set to introduce a freeze on bin charges which would at least give us some breathing space.

The following sets out an alternative outline to waste management. This is not a hard proposal; others will come up with better ideas.

However, it is clear that the current situation is not sustainable – from an environmental, economic, and social perspective.

1. A Public Service

Waste collection should be a public service. In the late 19th century great strides in public health came from water, sewerage and waste collection services; all provided as a public good.

We should return to this principle. This does not necessarily mean that waste collection would be provided directly by the local authority or some other public agency (but it could – see below).

However, rather than relying on market-forces to provide the service or set the charges, local authorities should re-assert active management and control of waste collection.

2. Service Provision

Each local authority would have the choice to either:

(a) Provide waste collection directly, or

(b) Franchise out the waste collection to a single operator in a single area.

The latter would, at least, end the competition ‘within the market’ and replace it with competition ‘for the market’. Companies could bid for areas but they would have to comply with a strict protocol covering service quality and workplace relations.

However, under this system they would not set the rate or collect charges. They would merely bid on the cost of providing the service.

As a complement, or an alternative route, a national public agency could be established which would act on an agency basis for local authorities.

This agency would advise local authorities on costs, help roll out a directly provided waste service (e.g. local authorities could be facilitated to combine to achieve economies of scale and efficencies) or manage the franchising administration.

3. Financing Service Provision

It is difficult to estimate how much households nationally spend on waste collection. Prices are higher outside Dublin – in some cases considerable so. In 2006 the Ombudsman showed average yearly charges ranging from €200 to €400 a year.

The CSO’s Household Budget Survey – from 2009/10 – shows a national average of approximately €200 per year per household.

This should be treated as a proxy as it includes sewerage and skip hire but these make up only a small expense relative to waste. In any event, the distribution of costs would be approximately the same.

graph

Unsurprisingly, the distribution of costs is highly regressive – given that waste charges are not related to income.

The lowest 10 percent income cohort pays more than five times the amount as the highest 10 percent – measured as a proportion of disposable income; and nearly three times the national average.

We could bring the entire cost be brought back into general taxation with free provision of service. There are two potential problems with this.

First, is the opportunity cost: with so many areas crying out for resources (housing, health, education, investment, social protection, a range of public services), the new expense of free waste collection would crowd out spending in other areas.

Second, is the lack of recycling incentives (though this is more contestable).
Nearly everyone is required to pay for a service – those in work and those reliant on social protection. So the issue isn’t so much charge vs. free; rather it is regressive charge vs. progressive charge.

Therefore, a fractional levy on all income, including capital income (e.g. 0.3 percent) deducted at source should be sufficient to fund a public waste collection service. Some may argue that those on social protection shouldn’t have to pay the levy – but they pay for highly regressive charges already.

A fractional levy would yield them considerable savings. All households with a combined income of approximately €80,000 would be better off – that is, most households.

What about recycling?

It is often asserted that pay-by-weight incentivises recycling. This is never quantified but currently Ireland is an EU leader in recycling.

We have the third highest recycling rate, behind Slovenia and Germany; and are well above the EU average. And that’s with only 20 percent of households paying on a pay-by-weight basis.

If pay-be-weight is brought in, it could be done on the basis of charging for ‘excessive’ waste. In other words, each household would get a ‘waste-free allowance’.

But incentivising recycling is more than just about ‘sticks’; there should be carrots as well. For instance, in the Dublin North Inner City the bring centre closes at four and is not open at the weekend – hardly helpful for households in full-time work.

When visiting other European cities, one sees small recycling banks in a number of places; in Dublin there are relatively few.

And if one is concerned with the ‘polluter pays’ principle, the household is merely the final user in a chain of waste. In Germany, supermarkets are required to have recycling banks on site, so that households can get rid of much of the packaging before leaving.

The point in all this is that levies and pay-by-weight charges would be set by public authorities which would go to pay for the price of either directly provided or franchised services.

Appropriate waivers or additional allowances could be granted to households with special needs. These wouldn’t be set by private companies but democratically accountable officials in a public market.

4. Beyond Just Picking Up Waste

There are three further potential benefits from this system.

First, the entire sector would be subject to a Sectoral Employment Order (SEO) which would regulate pay and working conditions.

Since the privatisation of the waste services, wages have been driven down by employers. A SEO would ensure that competition for the market is not based on squeezing labour but is based on service quality.

Second, if a national public agency was set up, they could take charge of managing landfills and waste chains. The agency could maximise renewable energy sources from landfill gas and waste-to-energy projects – so that we get an environmental (and commercial) return.

If the agency established an R&D unit, this could research renewable projects, best-practice in waste management, recycling initiatives, etc.

Third, all private companies that bid for franchise contracts would be required to publish their annual financial statements – just like so many other businesses are required to. This would provide commercial accountability.

This outlines one model. There are other models. If the Minister announces a charge-freeze, we have a year to work out a new model.

And there is a strong argument that any model that emerges from such discussions should be grounded in waste collection as a public service.

Michael Taft is Research Officer with Unite the Union. His column appears here every Tuesday. He is author of the political economy blog, Unite’s Notes on the Front. Follow Michael on Twitter: @notesonthefront

Rollignnews


Michael TaftPodcastCover Tunein

From top: Michael Taft; William Campbell

He knows stuff.

Journalist William Campbell meets soft spoken economic number cruncher Michael Taft in the latest episode of Here’s How., William’s excellent, in fairness, Irish current affairs podcast.

William writes:

Broadsheet regular Michael Taft wants the government to promote Irish-owned industry. He says it’s not to be like De Valera’s Economic War in the 1930s, but is it possible in an open economy in the high-tech age?

Listen here

redcow

Michael-Taft

From top: The Red Cow Interchange; Michael Taft

Excluding construction, only 6,700 jobs were created outside Dublin in the last year.

Michael Taft writes:

Some commentators have recently challenged the assertion that there is no recovery outside Dublin.

Dan O’Brien does up the numbers and show, with the exception of the West and recently the Mid-East, jobs growth has been robust outside Dublin. Stephen Kinsella made a similar point in a recent Sunday Business Post article.

What they point out is correct.

However, I want to look under the hood and see in what sectors jobs are being created.

In this post I will focus on the market economy. This is essentially the private sector which contains almost all traded sectors (that is, almost all sectors that trade internationally).

This excludes non-market sectors: public administration, education, health, arts/leisure and the agricultural sector. These are called non-market because of their high reliance on public sector activity or public subsidies. There are few traded goods and services in this sector.

What is the breakdown between Dublin and outside Dublin when it comes to the market economy?

Let’s first look at the total economy – both market and non-market sectors.

1

Over the last four years there has been more job creation outside Dublin than in the capital city (though we have to remember that the CSO undertook an adjustment in their sampling base which saw agricultural employment adjusted upwards significantly, though it didn’t necessarily rise in the economy).

In the last year, however, Dublin has benefitted from most of the job creation in the state – 57 percent of the jobs created were in Dublin.

2
When we turn to the market economy, however, a different story emerges.

Whether in the last four years or the last year, Dublin has generated approximately two-thirds of jobs in the market economy.

Outside Dublin, even though 70 percent of the total labour force resides there, only a third of jobs were generated. That is a severe imbalance.

Let’s drill down one more time and examine the amount of job creation excluding construction. This is not to suggest that construction isn’t an important sector; and after the hit this sector took in the recession there will be a rise as the recovery sets in.

But over-reliance on construction, as we know to our cost, is unhealthy.

At the height of the boom – 2007 – construction employment made up 13 percent of all market economy employment in Dublin; outside Dublin it made up over 21 percent.

3

When we exclude construction, Dublin has generated 80 percent of jobs in the market economy – leaving the rest of the country well behind.

Let’s put an actual number on this. In the last year only 6,700 jobs were created outside Dublin in the market economy when we exclude construction. Let’s run through the sectors this includes:

Mining * Manufacturing * Utilities * Wholesale & Retail * Transport & Storage * Hotels & Restaurants * Information & Communication * Financial Services * Professional, Technical & Scientific * Administrative and Support Services

In all these sectors only 6,700 jobs were created outside Dublin last year. That’s not a great trend even if it is heading upwards in the last year.

And this is outside Dublin – not an urban/rural divide.

Outside Dublin there are large urban areas such as Cork and Galway and substantial city/towns such as Drogheda and Wexford.

We don’t have the data available to breakdown how much job creation is occurring in strictly rural areas but it is reasonable to assume that it is proportionally lower than larger cities and towns.

In other words, we may be seeing an actual decline in the rural areas leading to higher unemployment, emigration (internal and foreign) or withdrawal from the labour force. This, combined with an ageing population and lower birth rates, could spell trouble for large swathes of the country.

None of this is surprising. Market-led job creation will see a trend towards urbanisation as capital and labour are drawn to clusters (IFSC and digital companies) and areas of better infrastructure such as telecommunications.

If the Government is serious about a rural or regional strategy it will have to mobilise capital and enterprise activity through public sector mechanisms, which is not the same as the public sector.

There is only so long an area or region can rely on non-market services and construction.

However, if the Government relies on grants and tax incentives and ‘enterprise zones’, to grow rural economies they will be disappointed; the problem is that there is less and less capital to incentivise in these areas.

We will continue to see many areas outside Dublin lag the capital city and other major urban areas.

And this will be costly affair – both in terms of public resources; but most of all, the large scale squandering of national and regional assets.

Michael Taft is Research Officer with Unite the Union. His column appears here every Tuesday. He is author of the political economy blog, Unite’s Notes on the Front. Follow Michael on Twitter: @notesonthefront


Payslip_large
Michael-Taft

From top: Salary payments; Michael Taft

Most of the income increase over the last five years has been concentrated among higher-income groups

Michael Taft writes:

In a previous blog I discussed the issue of who is benefiting from income increases, using national accounts and the Survey on Income and Living Conditions.

Here’s another look at the issue, this time with the assistance of the CSO’s Earnings database, focusing on wages. This will give us another, potentially more provocative, look at the issue.

That wages are rising is not in doubt.

Since wages (average weekly earnings) bottomed out in 2011,there has been a growth of 7 percent in the private sector while public sector wages have flat-lined. This has resulted in an economy-wide growth of 3 percent.

We always have to be aware of the compositional effect, though – a change in the composition of the group you are measuring.

Here is a simple example: we are measuring the average income of all customers in the pub.There’s 10 customers (slow night) and they have an average income of €36,000.

Then a millionaire walks in. We measure the same group – all the customers of the pub; but now the average is substantially higher. The original 10 customers haven’t experienced any change in income; it’s just that the composition of the group we’re measuring has changed.

So the 7 percent increase in private sector weekly earnings doesn’t mean every worker received that wage increase – more jobs created in in high income sectors (financial, information & communication) will change the composition.

With that caveat, let’s proceed to the next measurement.

The CSO measures average weekly earnings of three types of employees:

Mangers & Professionals: this includes associated professionals
White-Collar Employees: this includes clerical, sales and service employees
Blue-Collar Employees: this includes production, transport, craft and other manual workers

How have these two groups fared?

graph

Managers & professionals have been big gainers – over €100 per week, or nearly 10 percent increase. All other employees, however, have seen their weekly incomes fall. Even if with a compositional effect, its’ a significant difference.

There are some differences when we look under the hood. In the industrial sector (manufacturing, utilities, and mining), the three groups experience similar increases with managers & professionals receiving a 11 percent increase, white-collar workers receiving a 10 percent while blue-collar workers received a 14 percent increase.

However, the rest of the economy brings down the average of the latter two groups.

Rooting under the hood some more here’s another interesting finding: the Information and Communication sector makes up 3.9 percent of all employees in the economy. Yet this sector accounted for 21.2 percent of the entire increase in average weekly earnings.

This shouldn’t be too surprising given the number of multi-nationals in this sector that have located and expanded here in the last five years. Still, it gives evidence of the concentration of earnings.

What does all this mean? Even with a compositional effect, it shows that most of the income increase over the last five years has been concentrated among higher-income groups.

Here are the annualised average earnings for the three categories of workers in the first quarter of this year:

Managers & Professionals: €62,300

White-Collar Employees: €24,500

Blue-Collar Employees: €26,100

Again, we have to mindful that, especially among service workers (e.g. hospitality), some of this difference can be accounted for by less working hours.

We can’t say how much because the data doesn’t provide earnings per hour or working hours; we can’t produce full-time equivalents.However, Information & Communication employees earn nearly three times the hourly wage as hospitality workers – even more of a gap than the annualised earnings above.

Bottom-line: earnings inequality is growing in the economy. This may not mean much if you don’t think inequality is a problem.

However, if you think rising inequality will result in economic inefficiency and social erosion then you should be concerned. Very concerned.

Michael Taft is Research Officer with Unite the Union. His column appears here every Tuesday. He is author of the political economy blog, Unite’s Notes on the Front. Follow Michael on Twitter: @notesonthefront